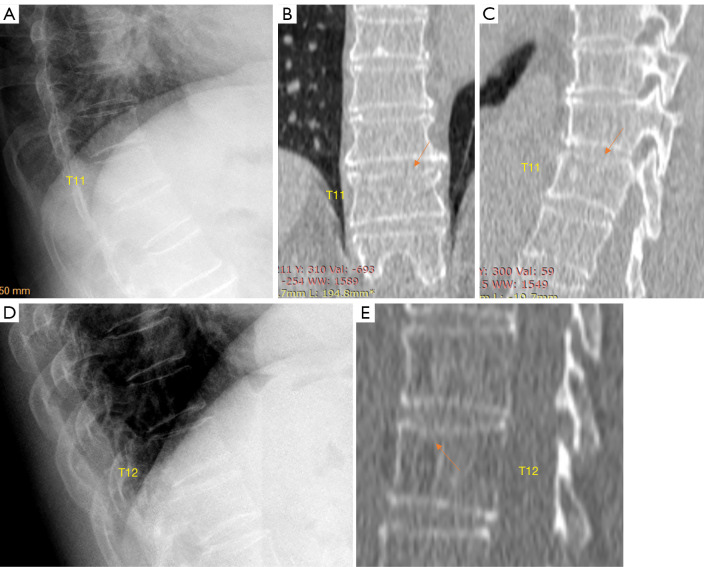
Figure 5.
Chest imaging of two elderly women (A-C for one patient and D, E for another patient). Radiograph (A) shows T11 vertebra minimal wedging without endplate depression; while CT (B,C) of this patient show upper endplate fracture/depression (arrow). Lower endplate depression is also considered (C). Radiograph (D) shows T12 vertebra minimal wedging without endplate depression; while CT (E) of this patient show T12 upper endplate depression (arrow) and wedging of this vertebra appears more apparent. Reproduced with permission from (17). CT, computed tomography.

