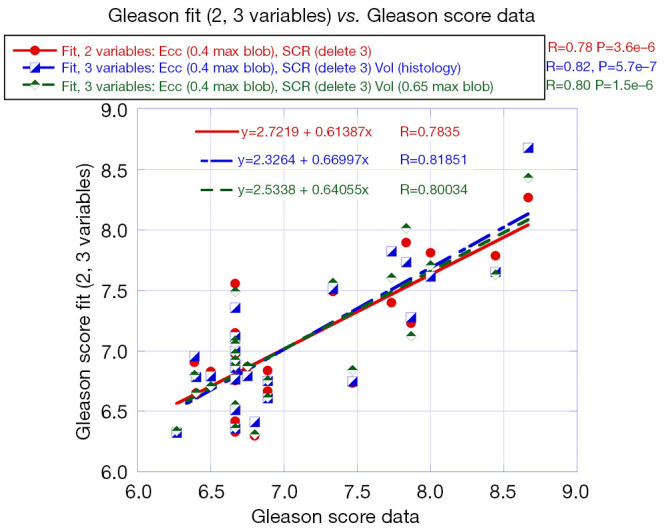
Figure 3.

The multivariate fit using ACE/MP-MRI [eccentricity for the largest blob with a 0.4-threshold plus SCR after applying a cutoff of 3 principal components] against data for Gleason score. Volume (histology, MP-MRI) added for three variable fit to Gleason score. SCR, signal to clutter ratio; ACE, adaptive cosine estimator; MP-MRI, multi-parametric magnetic resonance imaging.
