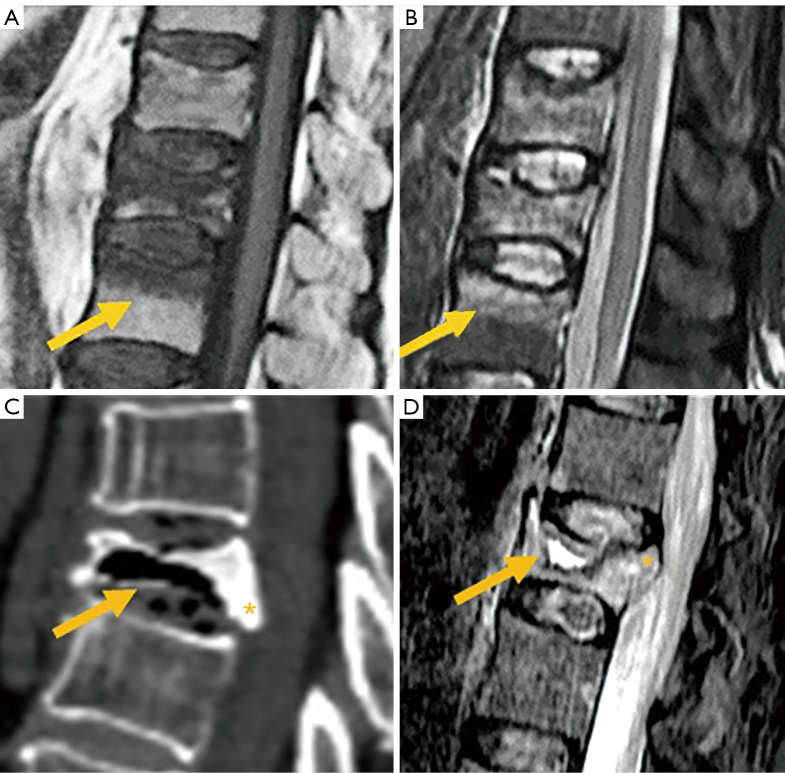
Figure 10.
Osteoporotic fractures. Sagittal T1 (A) and STIR (B) showing the band like edema pattern (arrows). (C) Burst fracture with intravertebral vacuum cleft (arrow) and retropulsion of the posteroinferior margin (*). (D) Sagittal STIR with intravertebral liquid cleft (arrow) and retropulsion of posterosuperior margin (*). STIR, short tau inversion recovery.

