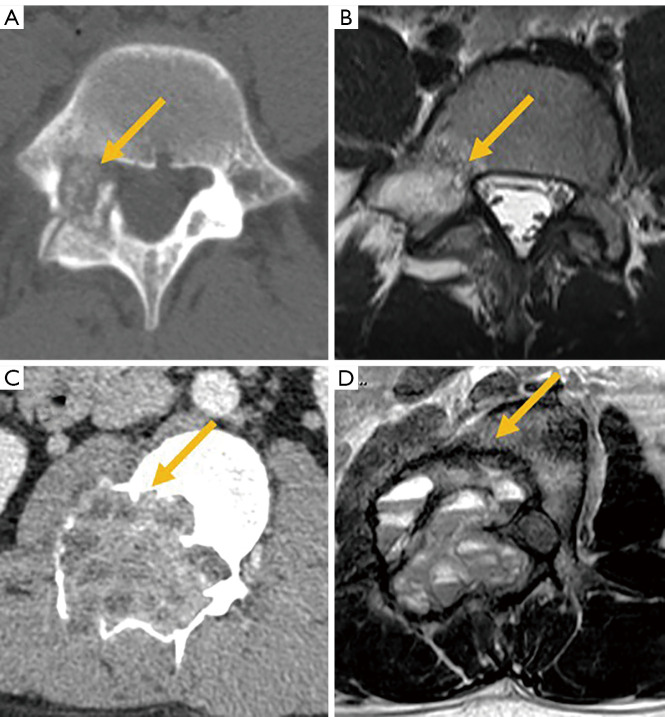
Figure 30.
Osteolytic lesions of the spine. (A) Axial CT image of osteoblastoma showing the osteolytic lesion (arrow), and (B) edema pattern on MRI (arrow). (C) CT of aneurysmal bone cyst (arrow). (D) T2 weighted image showing fluid-fluid levels in the same case (arrow). CT, computed tomography; MRI, magnetic resonance imaging.

