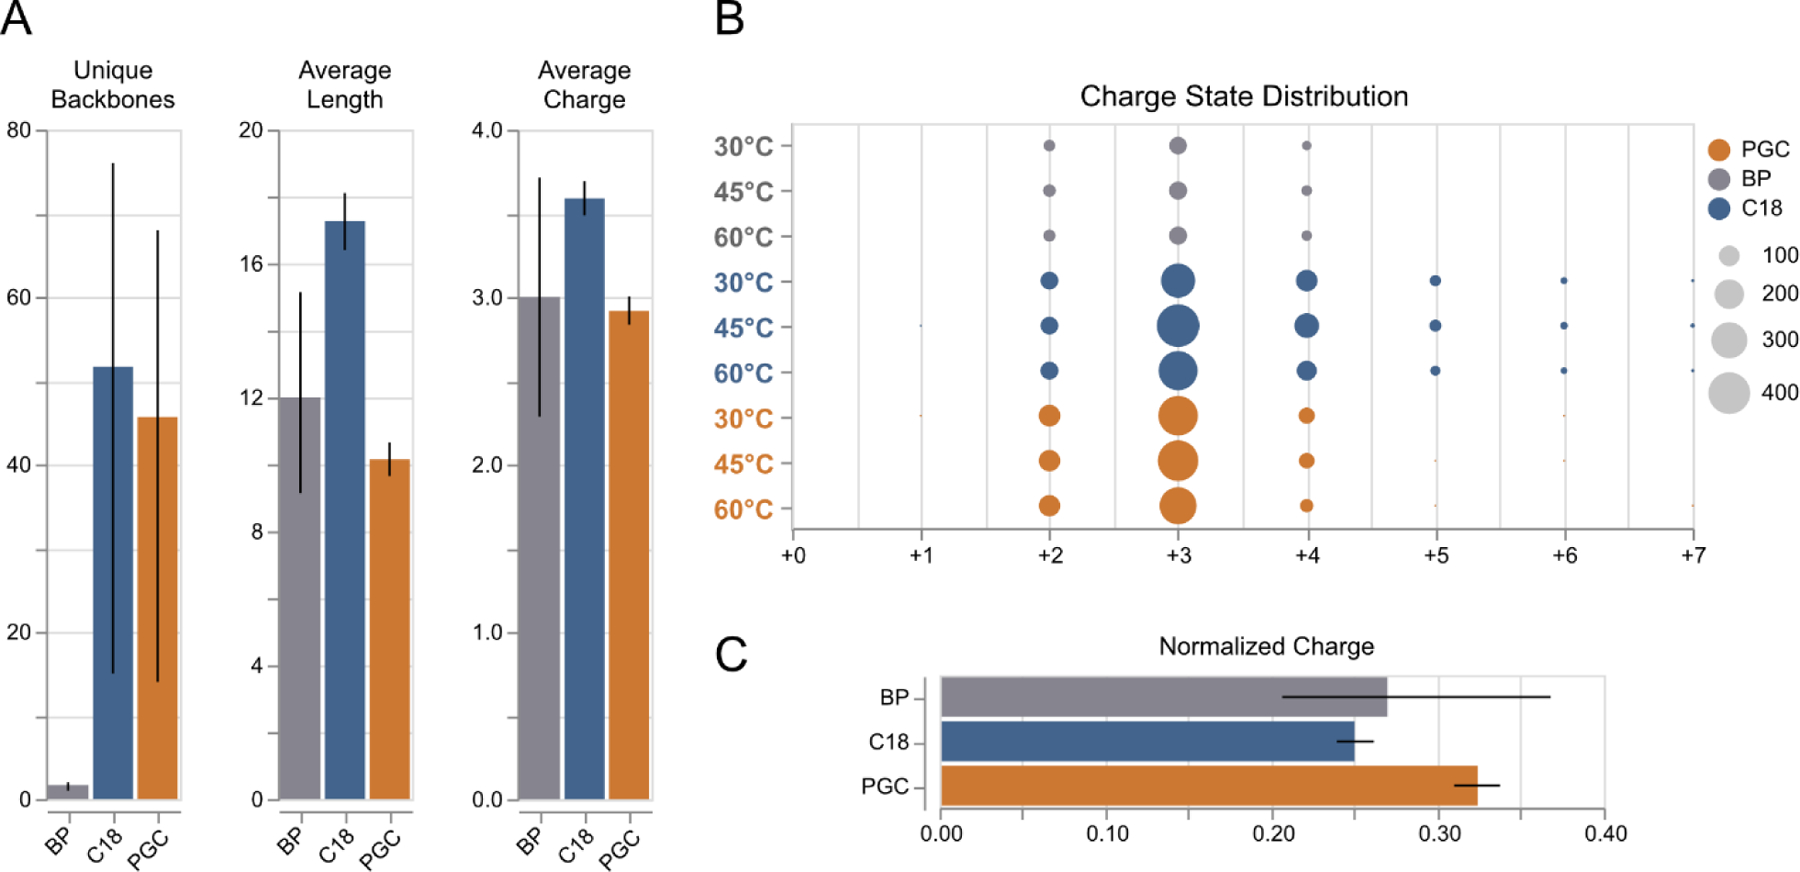
Figure 4.

Peptide level differences between glycopeptides identified across all experiments. A) Distribution of number unique backbones identified, average glycopeptide length, and average glycopeptide charge between all separation regimes. Error bars: 95% confidence inteval, n=3 (each sample). B) Distribution of glycopeptide charge states between all separations and temperatures. C) Normalized charge per glycopeptide, shown as a function of average charge/amino acid residue. Error bars: 95% confidence inteval, n=3 (each sample).
