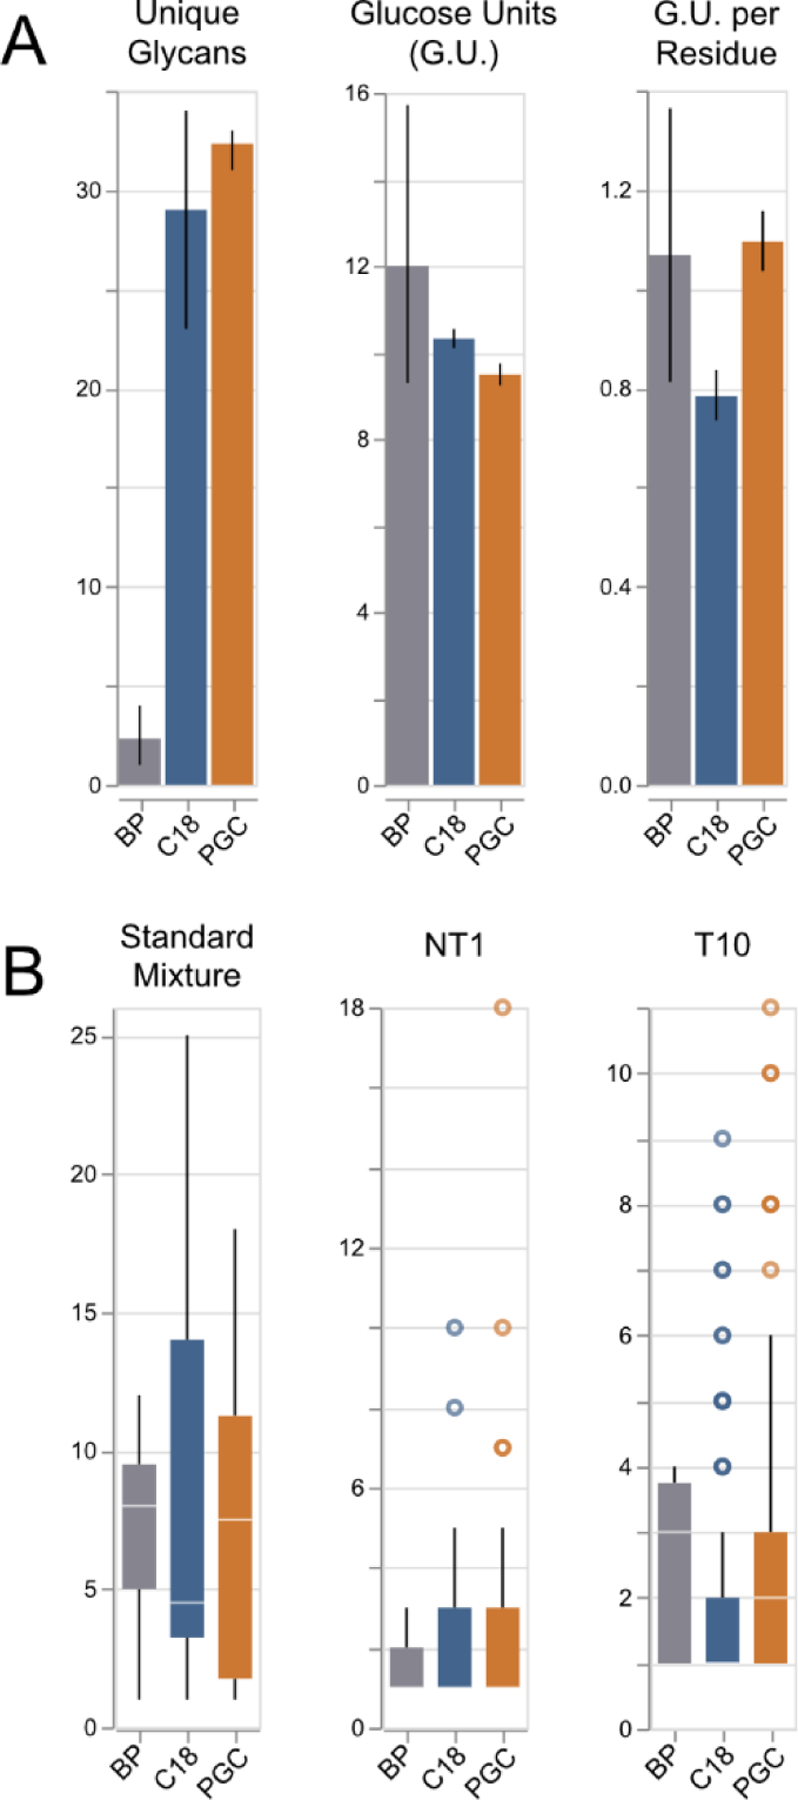
Figure 5.

A) Distribution of # unique glycans, glucose units per glycan, and glucose units per amino acid residue. Error bars: 95% confidence inteval, n=3 (each sample). B) Boxplots displaying the number of glycans associated with retained peptide bacbones. Note: for samples “NT1” and “T10”, the median values of RPLC are found to be 1, making them difficult to view here.
