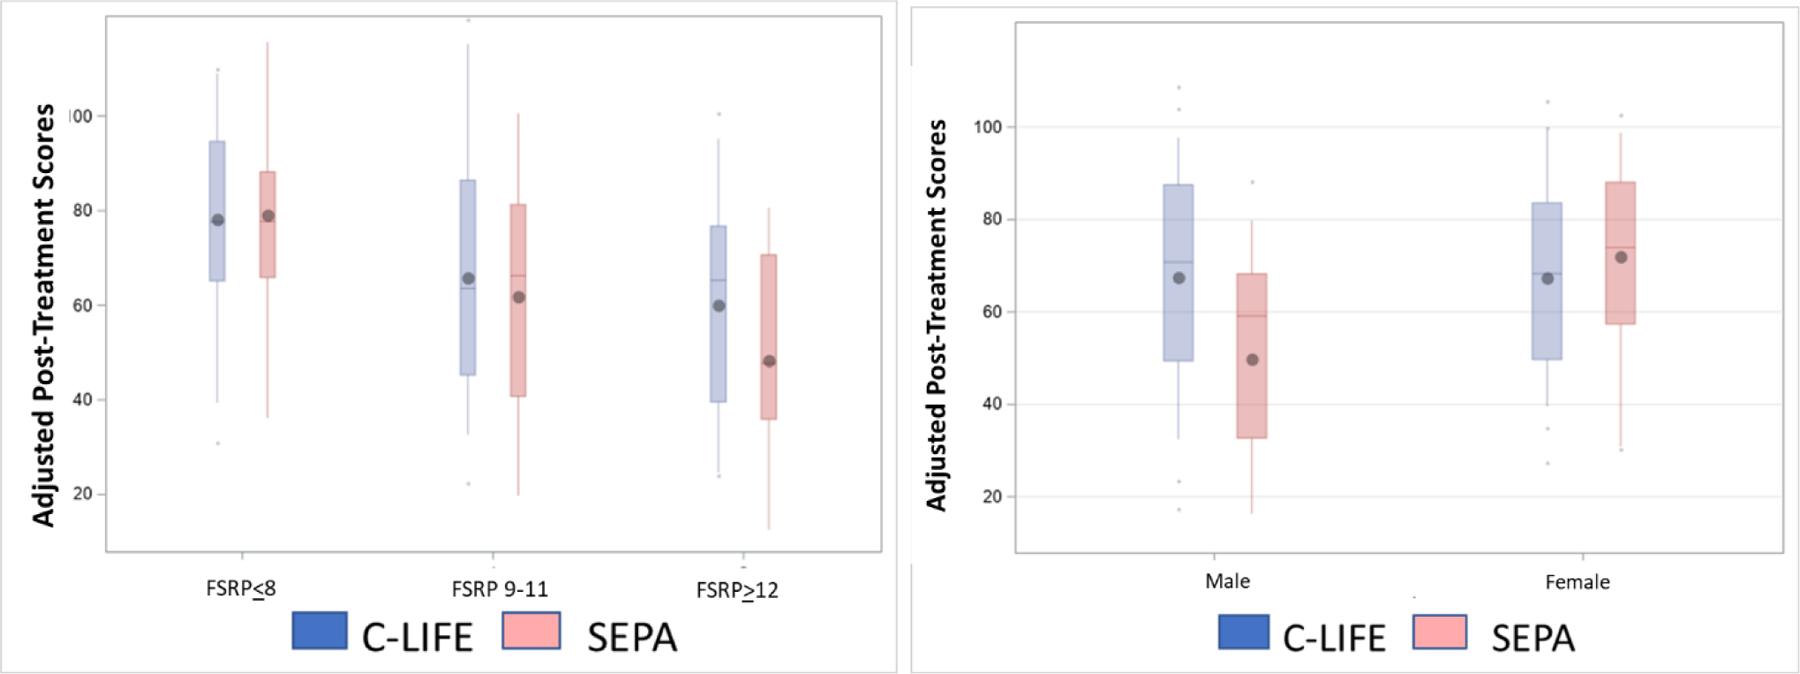
Figure 2.

(A) Group differences in Processing Speed by baseline stroke risk (P = .043 for interaction). Using the Framingham Stroke Risk Profile, groups are subset into those with low (≤8%), moderate (9–11%), and high (≥12%) risk of stroke from baseline assessments. (B) Group differences in Memory by biological sex. Male participants in C-LIFE appeared to show greater Memory improvements compared to those in SEPA, with equivocal changes in female participants (P = .026 for interaction). Data are presented as a mean rank score within each cognitive domain.
