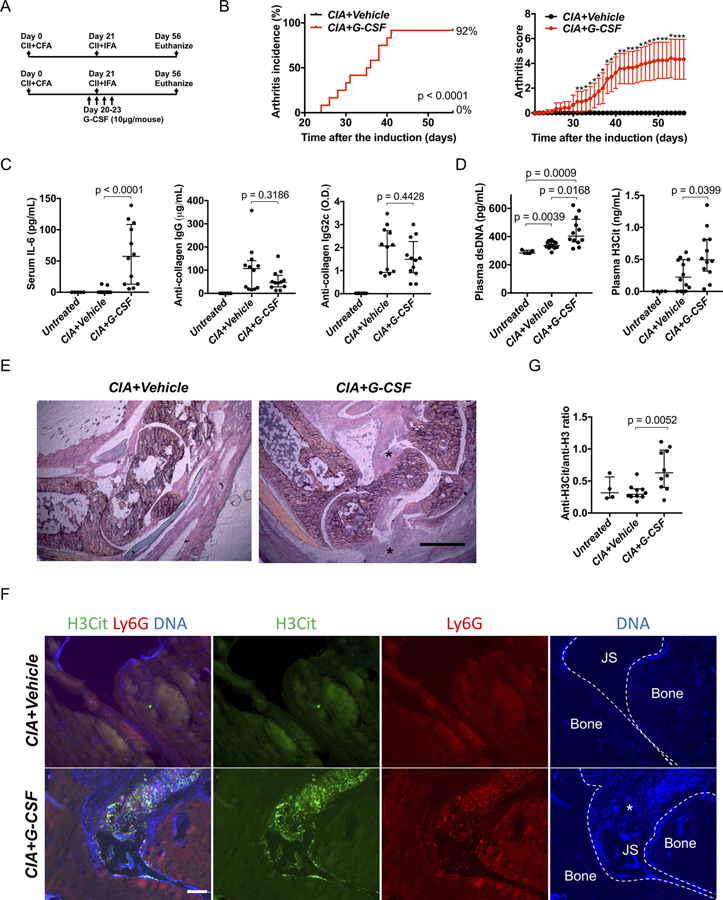
Figure 1. Exacerbation of collagen-induced arthritis on C57BL/6 strain by adding G-CSF injection.
A: Injection schedule. B: Arthritis incidence (left) and severity (right) of vehicle-treated mice and G-CSF-treated mice (n=12:12). For arthritis severity, each line shows a mean with a 95% confidence interval. The severity scores on each day were used for Wilcoxon rank-sum test (*: p < 0.05). C: Serum IL-6 and serum anti-collagen IgG and IgG2c antibody on day 56 (n=12:12). D: Plasma levels of double stranded DNA (left) and citrullinated histone H3 (right) on day 22 (n=12:12). E: Representative images of hematoxylin-eosin (HE) stains using ankle joints (*: Expansion of synovial tissue seen only in G-CSF-treated mice, scale bar = 500μm). F: Representative images of immunostaining of Ly6G and H3Cit of ankle joints. (JS: Joint space, *: Synovial tissue, scale bar = 100μm) G: The comparison of ratio of anti-H3Cit antibody and anti-native H3 antibody calculated from ELISA optical density values in vehicle-treated mice and G-CSF-treated mice (n=10:10:4, vehicle-treated mice, G-CSF-treated mice, untreated mice).

