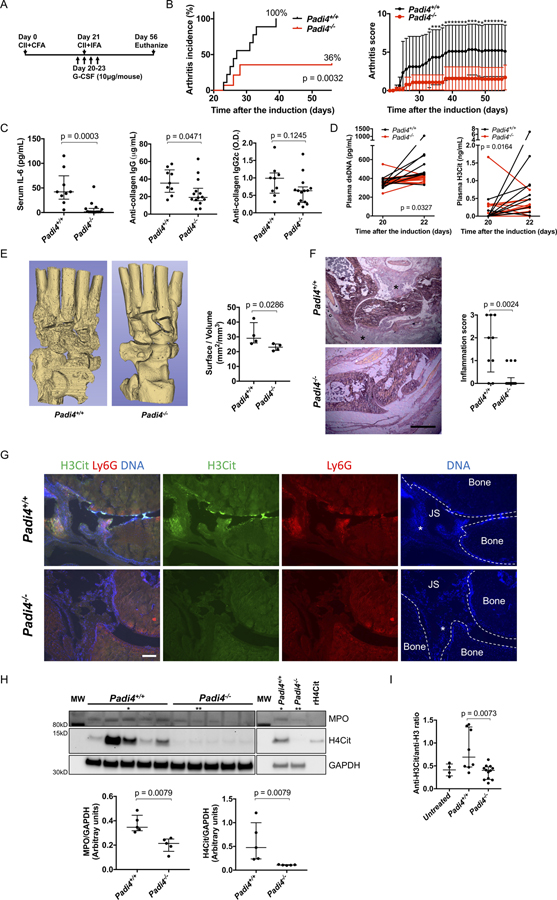
Figure 2. Comparison of Padi4+/+ and littermate Padi4−/− in the G-CSF-modified CIA model.
A: Injection schedule. B: Arthritis incidence (left) and severity (right) of Padi4+/+ and Padi4−/− (n=9:14). For arthritis severity, each line shows a mean with a 95% confidence interval. The severity scores on each day were used for Wilcoxon rank-sum test (*: p < 0.05). C: Serum IL-6 and serum anti-collagen IgG and IgG2c antibody on day 56 (n=9:14). D: The changes of plasma levels of double stranded DNA (left) and citrullinated histone H3 (right) from day 20 to day 22 (n=9:14). The difference in change of value from day 20 to day 22 were used for Wilcoxon signed-rank test. E: Representative images of micro-CT of ankle joints (left) and quantification of eroded surface of joints (right, n=4:4). F: Representative images of HE stains using ankle joints and determination of inflammation in HE stains (left) by scale of 0 (no inflammation) to 3 (severe inflamed joint) depending on the number of inflammatory cells in the synovial cavity (exudate) and synovial tissue (infiltrate) determined blindly of genotype (right, n=9:14) (*: Proliferated synovial tissue. scale bar = 500μm). G: Representative images of immunostaining of Ly6G and H3Cit of ankle joints (JS: Joint space, *: Synovial tissue, scale bar = 100μm). H: The blot of synovial tissue (n=5:5) for MPO, H4Cit, and GAPDH (upper, MW: molecular weight marker, rH4Cit: recombinant H4Cit as a positive control) and quantification by densitometry (lower, relative expression to GAPDH). * and ** indicates the same samples, respectively. I: The comparison of ratio of anti-H3Cit antibody and anti-native H3 antibody calculated from ELISA optical density values in Padi4+/+ mice and Padi4−/− mice (n=8:12:4, Padi4+/+mice, Padi4−/− mice, untreated mice).

