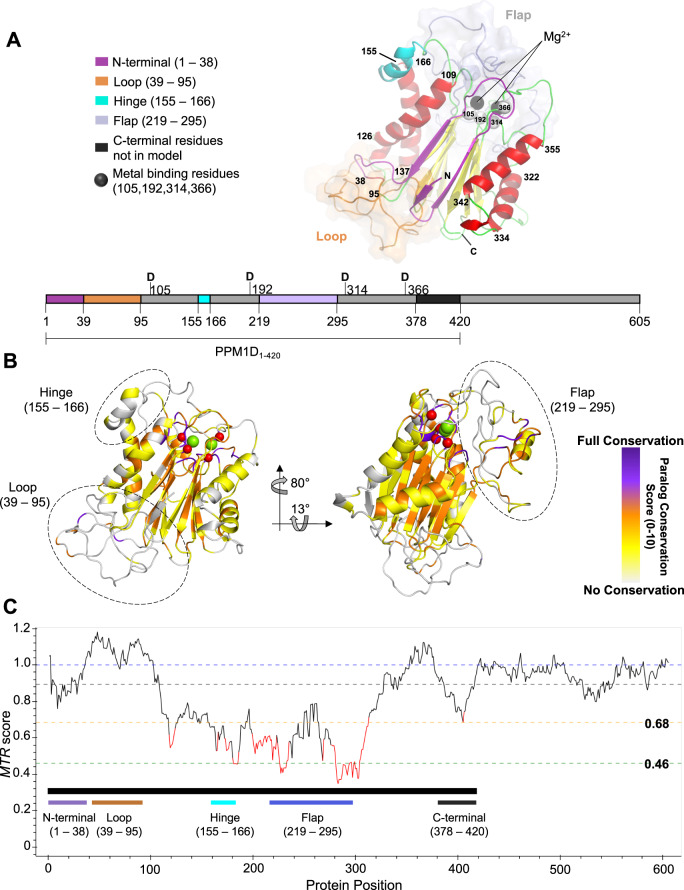
Fig. 1. Generation of a homology model and use of computational genetics to characterize PPM1D.
A PPM1D homology model of residues 1–377 highlighting key structural regions of interest. The N-terminus (purple), loop (brown), hinge (cyan), and flap (light purple) are highlighted along with predicted alpha-helices (red) and beta-sheets (yellow), with the remainder of the protein in green. The loop and flap region are shown with an overlaying surface representation to emphasize the lack of structure predicted by the model. The metal-binding residues and metal cations are highlighted as spheres in black and white, respectively. A 2D representation is shown below the homology model. B PPM1D paralog values superimposed on the homology model. For each residue, the degree of identity across the human PPM1D paralogs was assessed and scored from 0 to 10 (purple represents full conservation, white represent no conservation). C Representation of genetic constraint in the human germline at each residue as calculate by the missense tolerance ratio. A ratio of less than 0.68 and 0.46 are in the bottom 25% and 5% of scores across the protein, respectively.

