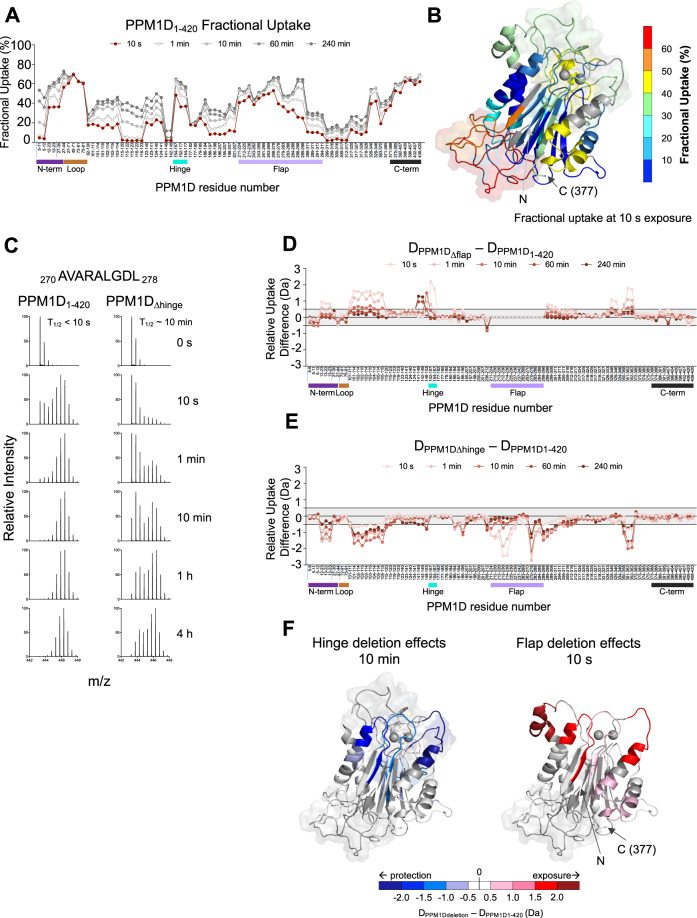
Fig. 4. PPM1D exists in multiple conformational states reflected by movement of the flap domain.
A HDX-MS measurements of deuterium uptake for PPM1D1–420 over time. The peptides analyzed run along the X-axis from the N-terminus (left) to C-terminus (right) and vertical tick marks between peptides are shown to indicate regions of missing coverage. Deuterium incorporation is represented as percent fractional uptake on the Y-axis, calculated as described in the “Materials and Methods” section. The 10 s exposure time point is shown in red to highlight the uptake values mapped in panel B. Reference plots are reported in Suppl. Data 1, the raw values of the plots are reported in Suppl. Data 2B Fractional uptake at 10 s exposure for PPM1D1–420 mapped onto the homology model. C Spectral analysis showing the change in EX1 kinetics for peptide 270 AVARALGDL 278 located in the flap region in PPM1D1–420 and PPM1DΔhinge. D Relative differences in deuterium uptake between PPM1DΔflap compared to PPM1D1–420. E Relative differences in deuterium uptake between PPM1DΔhinge compared to PPM1D1–420. F Differences shown in panels (D, E) between PPM1DΔhinge (left) or PPM1DΔflap (right) and PPM1D1–420 mapped onto homology model. Negative differences are represented in blue indicating protection from exchange, while positive differences are shown in red, indicating exposure to exchange as a result of the deletion. Darker colors indicate a stronger relative difference. For panels (A, D, E) the bars below the X-axis represent the N-terminus (purple), loop (brown), hinge (cyan), flap (light purple), and C-terminus (black) of the protein. Source data are provided as a Source Data file.

