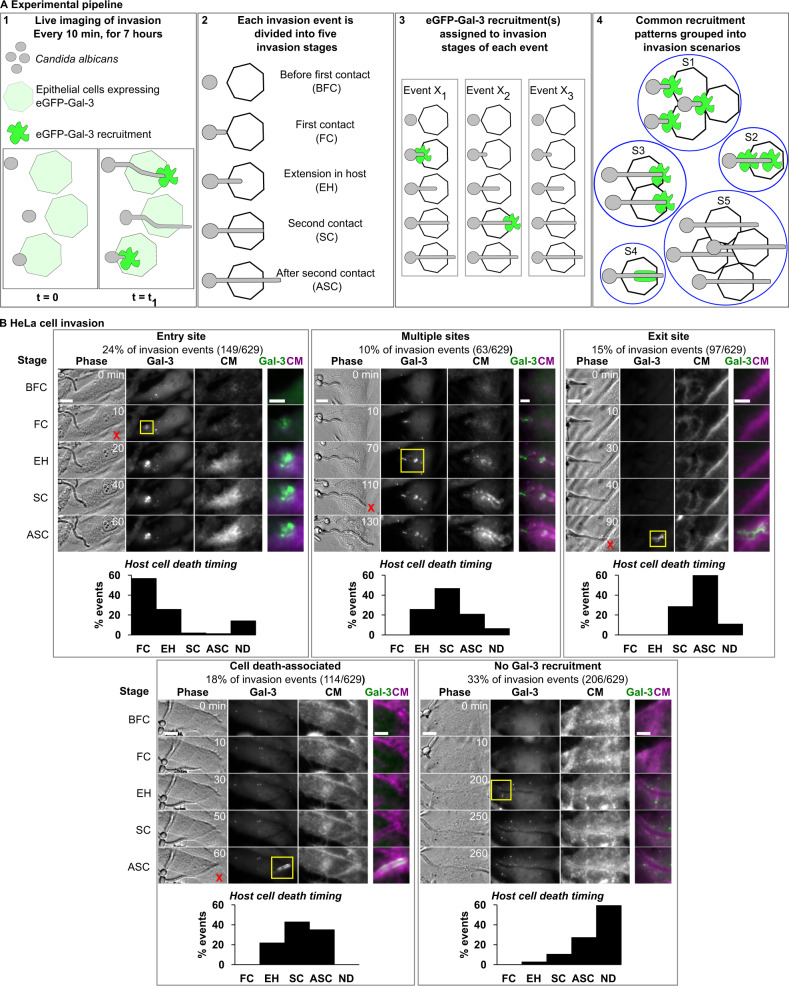
Fig. 1. C. albicans epithelial cell invasion studied using eGFP-Galectin-3 damage sensitive reporter and live-cell imaging.
The experimental pipeline (A) and results for HeLa invasion (B) are presented. (A1) C. albicans invasion of epithelial cells stably expressing eGFP-Galectin-3 is studied using live-cell imaging. Localized high-intensity eGFP-Galectin-3 recruitments recorded are indicative of host membrane damage. (A2) Each invasion event, defined as a single interaction between a C. albicans hypha and a host cell over time, is sub-divided into five invasion stages: before first contact with host plasma membrane (BFC), first contact with host plasma membrane (FC), hypha extension within the host (EH), second contact with the host plasma membrane (SC), after second contact with the host plasma membrane (ASC). (A3) For every invasion event (X1, X2..), eGFP-Galectin-3 recruitments are assigned to the stage in which they occurred. (A4) All invasion events sharing common eGFP-Galectin-3 recruitment patterns are grouped into invasion scenarios (S1, S2..). B C. albicans HeLa invasion scenarios (n = 629 invasion events). For each scenario a representative invasion event is presented, divided into the five invasion stages described in (A). For each stage a single section is presented in phase, Gal-3, and CellMask (CM) channels, as well as an inset (yellow frame) containing a composite view of the Gal-3 (green) and CM (magenta) channels. Cell death (if it occurred) is marked with a red ‘x’ in the corresponding invasion stage. The distribution of cell death timing as a function of the invasion stage is presented for each scenario. ND stands for no cell death during invasion. Scale bars are 10 µm or 5 µm in insets. Source data are provided as a Source Data file.

