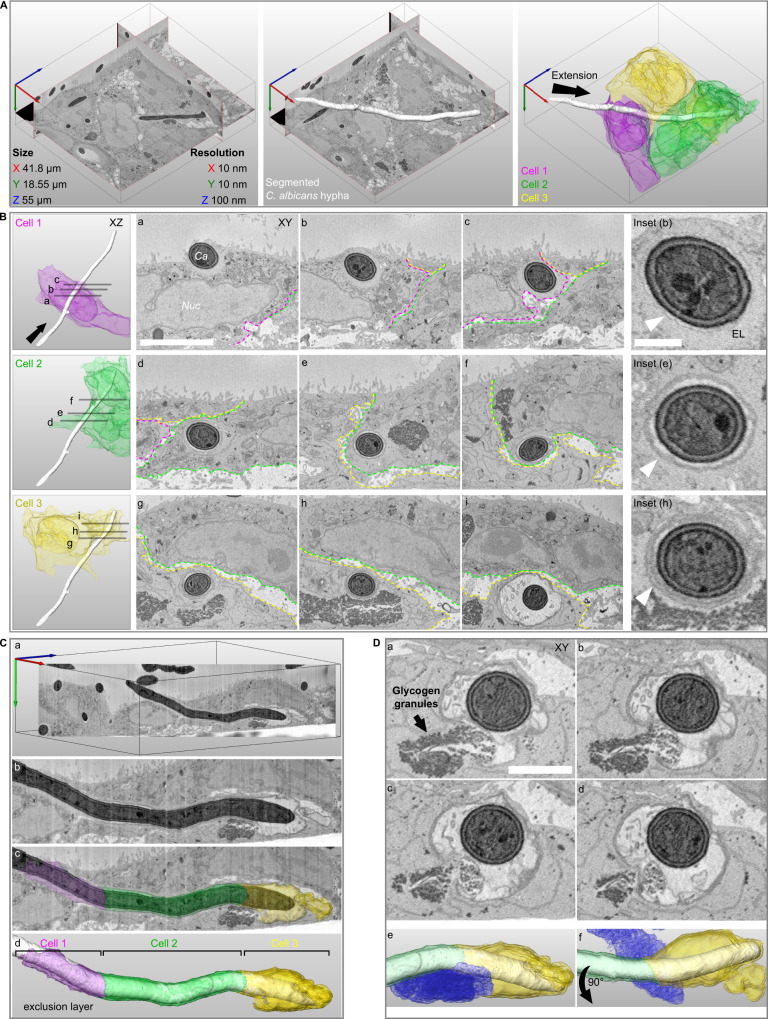
Fig. 4. Serial block face-scanning electron microscopy (SBF-SEM) of Caco-2 invasion.
A A representative SBF-SEM volume is presented together with dataset size and resolution in each axis (left panel). A C. albicans hypha in the process of invasion is visualized in three-dimensions (white, middle panel). Three invaded host cells are colour coded according to the sequence of invasion, cell 1 (magenta), cell 2 (green), cell 3 (yellow). The direction of filament extension is noted (arrow, right panel). B The organization of host membranes around the hypha is presented for each invaded cell with three cross-section views (Cell 1- a, b, c; Cell 2- d, e, f; Cell 3- g, h, i). The direction of filament extension is noted (arrow). The borders between cells are annotated according to the colours in (A) and the hypha (Ca) and the host nucleus (Nuc) are noted in (a). An inset from the middle cross-section in each cell is presented with arrowheads pointing to host membranes surrounding the hypha. The hypha in cell 1 is tightly enveloped by a thin membrane which in turn is surrounded by an ‘exclusion layer’ (EL) devoid of cellular structures (a, b, c, inset (b)). In cell 2, a thicker membrane enveloping a narrow lumen and the hypha is observed (d, e, f, inset (e)). In cell 3, two membranes surrounding a narrow lumen and the hypha are observed in (g, h, inset (h)). An ‘inflation’ containing multiple vesicles is observed in (i). C A cross-section through the hypha long-axis is presented, showing the continuous membrane structures across three cells (a, b). The ‘exclusion layer’ and membranes surrounding the hypha are visualized according to the invaded cell sequence (c, d). D A sequence of four sequential sections showing direct contact between the ‘inflation’ lumen and host glycogen granules (a–d). Glycogen granules are noted in (a). A visualization presented in the same orientation as in (C) shows the contact between the host glycogen store (blue) and the ‘inflation’ in cell 3 (e). A 90-degree rotated view is presented in (f). Scale bars are 5 µm in B, 1 µm in B inset and 2 µm in D.

