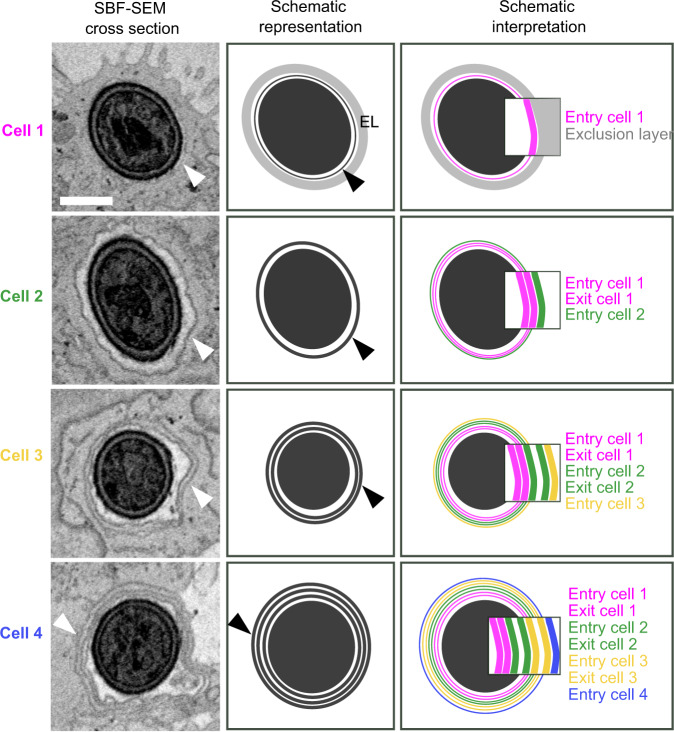
Fig. 5. Host membrane organization around a single hypha invading four Caco-2 cells in sequence.
Data presented is derived from an SBF-SEM volume containing a single invasion event through four host cells in sequence. A representative section from each invaded host cell in the invasion sequence is presented alongside a schematic representation, illustrating the exclusion layer (EL) and host membrane organization around the hypha in each invaded cell. Arrowheads indicate observed membranes and their corresponding schematic representation. A schematic interpretation is also presented, corresponding to the hypothesis that host membranes extend from each invaded cell into the next host cell in the invasion sequence, resulting in progressive membrane layer accumulation. Insets show in detail inferred membrane organization in accordance with this hypothesis, with each layer derived from a plasma membrane deformed upon hypha entry or exit from each corresponding invaded cell. The presented dataset corresponds to invasion site 9 in Supplementary Table 2 and is presented in Supplementary Movie 14. Scale bar is 1 µm.

