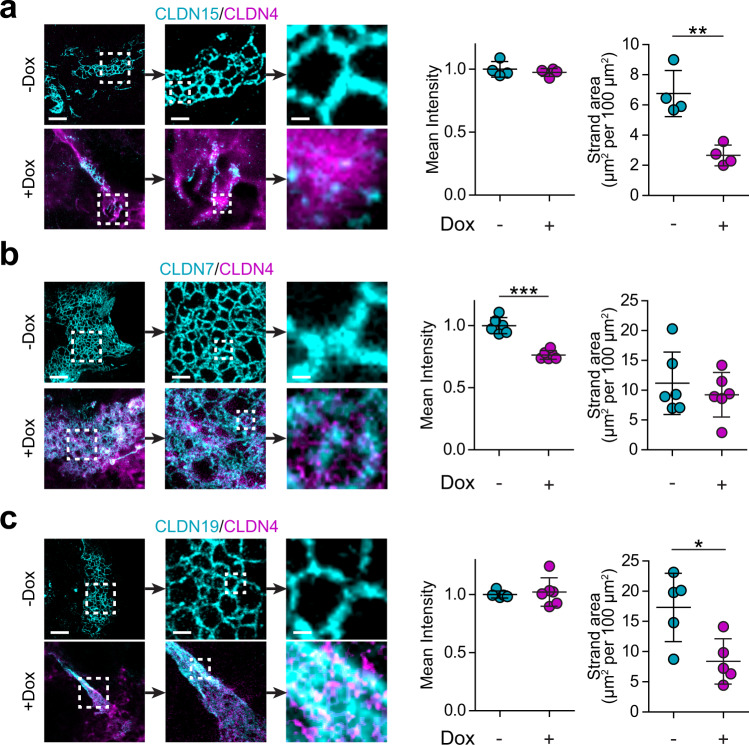
Fig. 6. Claudin-7, 15, and 19 strands are modified by claudin-4 expression.
a STED images show claudin-15 (cyan) meshworks are depolymerized by claudin-4 (magenta), similar to claudin-2 (see Fig. 5). n = 4 each for intensity and area, representative of 3 independent experiments. Two-tail unpaired t-test. **P = 0.003. b Claudin-7 (cyan) strand intensity is reduced and meshworks are rearranged in response to claudin-4 (magenta) expression. n = 4 each for intensity and area, representative of 3 independent experiments. Two-tail unpaired t-test. ***P < 0.0001. c Claudin-19 (cyan) strand meshworks collapse and form dense bundles upon claudin-4 (magenta) expression. n = 3 each for intensity and area, representative of 3 independent experiments. Two-tail unpaired t-test. *P = 0.019 (area). For each image set, progressive zooms are shown from left to right. Scales: 2 µm, 500 nm, 100 nm. In all plots, each data point represents the mean of 12–16 cells in 1 sample. Data are presented as mean ± SD and included in the Source Data file.

