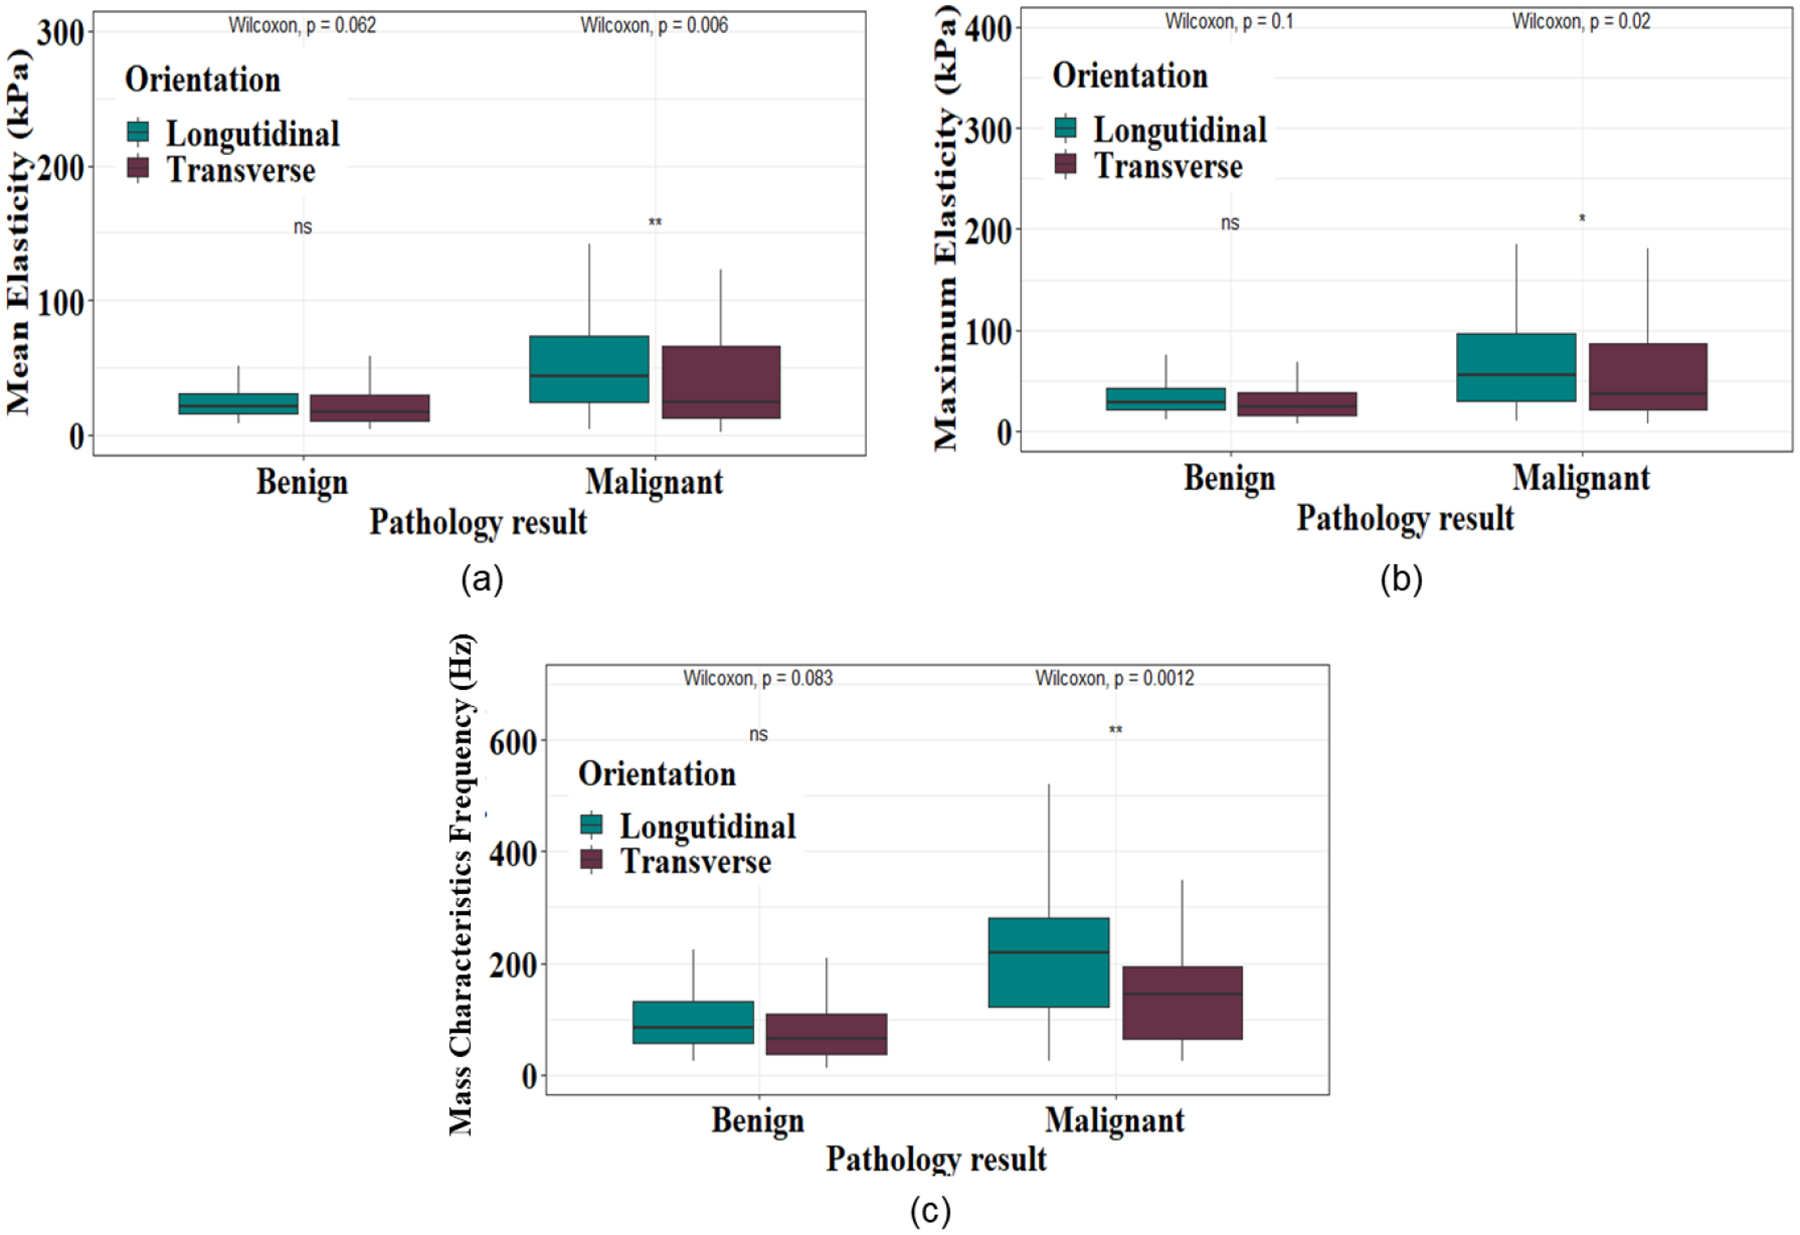
Figure 4: Comparison of shear wave elastography parameters between benign and malignant thyroid nodules.

(a) Comparison of the Emean measured along the transverse and longitudinal orientations for benign and thyroid malignant nodules. (b) Comparison of the Emax measured along the transverse and longitudinal orientations for benign and malignant thyroid nodules. (c) Comparison of the fmass measured along the transverse and longitudinal orientations for benign and malignant thyroid nodules. p value<0.05 indicates a statistical significance (* p<0.05, ** p<0.01).
