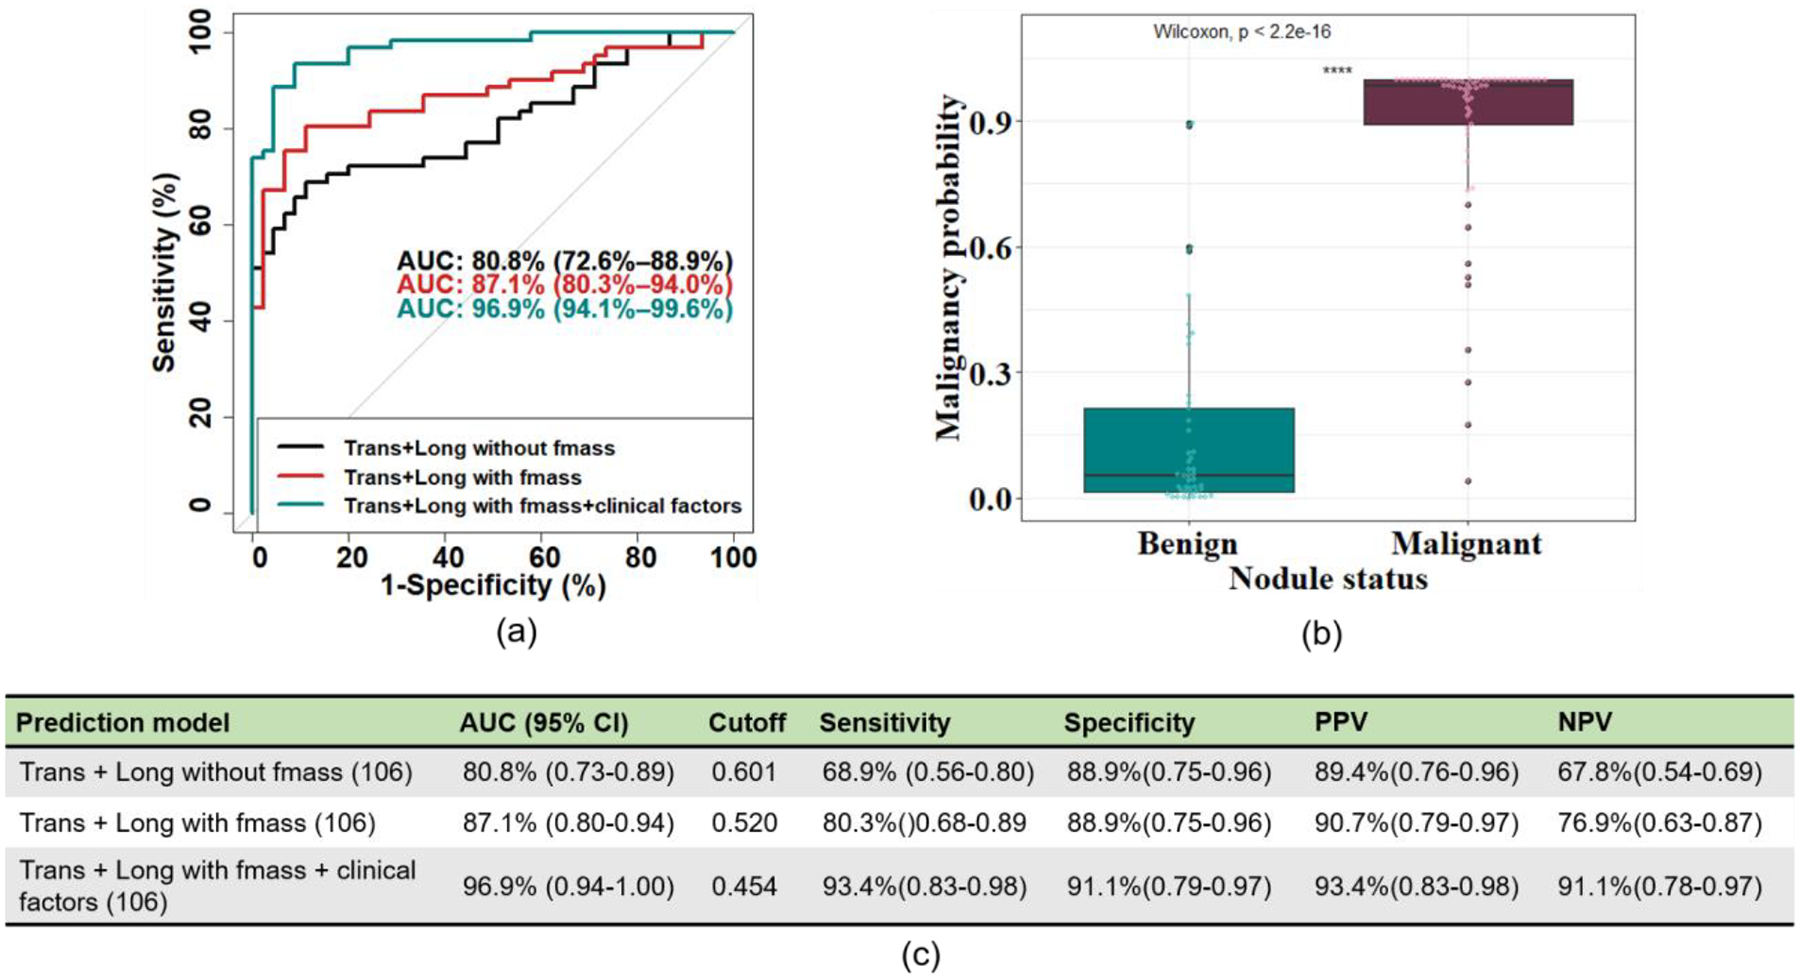
Figure 5: Ability of different prediction models to differentiate benign from malignant thyroid nodules.

(a) Receiver Operating Characteristic curves were generated using a multivariable logistic regression analysis to evaluate the ability of shear wave elasticity parameters with/without fmass and with/without clinical factors to discriminate benign from malignant thyroid nodules. The black curve is “Trans + Long without fmass”, the red curve is “Trans + Long with fmass”, and the teal curve is “Trans + Long with fmass + clinical factors”. (b) The boxplot was calculated with the multivariable logistic regression analysis from the “Trans + Long with fmass + clinical factors” model. (c) The summary of the ROC curves depicted in (a). Numbers in parentheses are the number of thyroid nodules included in the models. AUC: Area Under the Curve; Trans: Transverse; Long: Longitudinal; PPV: Positive Predictive Value; NPV: Negative Predictive Value.
