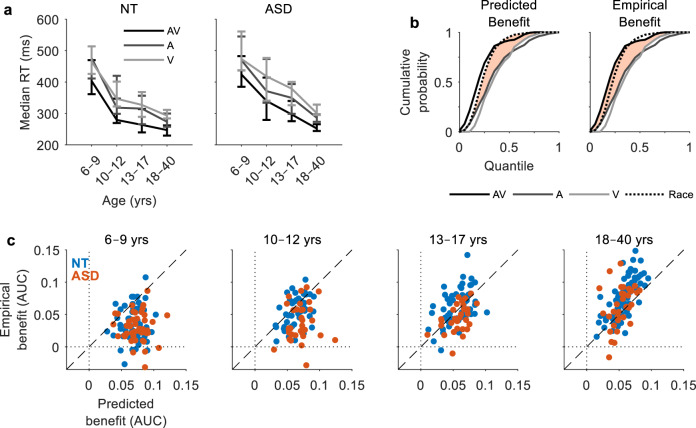
Fig. 1. Reaction times and multisensory benefits.
a Group median RTs for NT (left panel) and ASD (right panel) individuals as a function of age group. Error bars indicate 95% CIs (bootstrapped). b RT cumulative probability for each of the three stimulus conditions and the race model (Eq. 1). Predicted benefits (left panel) are quantified by the area between the CDFs of the race model and the faster of the unisensory conditions (Eq. 3). Empirical benefits (right panel) are quantified by the area between the CDFs of the multisensory condition and the faster of the unisensory conditions (Eq. 4). Data from an example NT adult participant. c Predicted benefits versus empirical benefits by age group. Each datapoint represents the area under the curve (AUC) for an individual participant (blue = NT, red = ASD).

