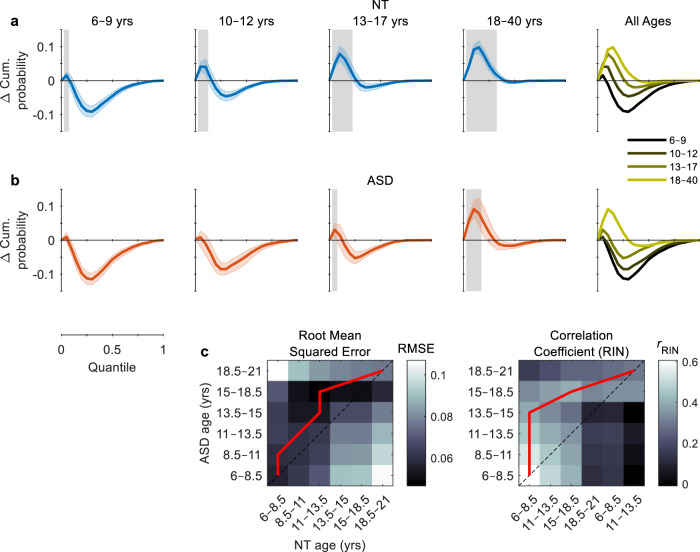
Fig. 2. Testing the race model.
a, b Multisensory facilitation was quantified by the difference between the CDFs of the multisensory condition and the independent race model. Positive deviations reflect the proportion of multisensory RTs that were faster than predicted by the race model. Gray shaded regions indicate significant positive deviations (p < 0.05, right-tailed permutation tests, tmax corrected). Coloured error bounds indicate 95% CIs (bootstrapped). c Root mean squared error (left panel) and RIN-transformed Pearson correlation coefficient (right panel) between the difference functions for NT and ASD participants of different ages (range: 6–21 years, increment: 2.5 years). Red lines indicate the minimum (left panel) and maximum (right panel) values of each row (i.e., the NT groups that were most similar to each ASD group). Divergence of the red line above the dotted midline indicates a potential delay in age-related changes in ASD.

