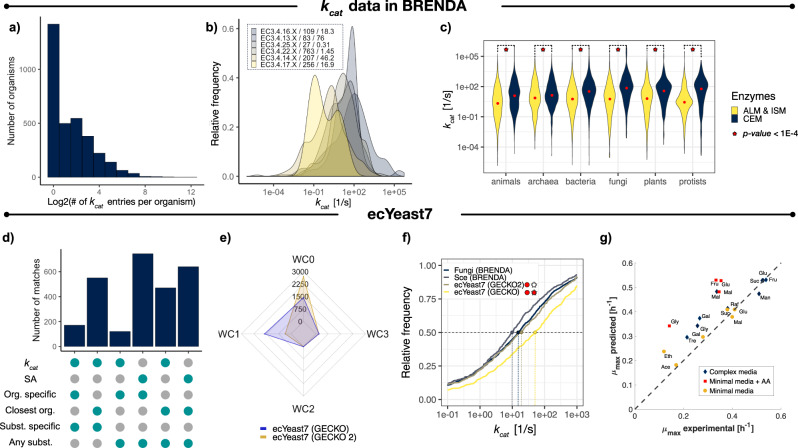
Fig. 1. kcat distributions in BRENDA and ecYeast7.
a Number of kcat entries in BRENDA per organism. b kcat distributions for closely related enzyme families. Sample size and median values (in s−1) are shown after each family identifier. c kcat distributions for enzymes in BRENDA by metabolic context and life kingdoms. Median values are indicated by red dots in each distribution, statistical significance (under a one-sided Kolmogorov–Smirnov test) is indicated by red stars for each pair of distributions for a given kingdom. CEM—central carbon and energy metabolism; ALM—Amino acid and lipid metabolism; ISM—intermediate and secondary metabolism. Computed P-values are 2.8 × 10⁻²⁷ for animals; 3.85 × 10⁻⁵ for archaea; 1.62 × 10–92 for bacteria; 1.024 × 10⁻³⁰ for fungi; 2.36 × 10⁻¹⁶ for plants and 4.75 × 10⁻²¹ for protists. d Number of kcat matches in ecYeast7 per assignment category (GECKO 2.0). e Comparison of the number of kcat matches for E.C. numbers with 0, 1, 2, and 3 introduced wildcards by GECKO 2.0 and GECKO kcat matching algorithms. f Cumulative kcat distributions for: all S. cerevisiae entries in BRENDA, all entries for fungi in BRENDA, ecYeast7 enhanced by GECKO and ecYeast7 enhanced by GECKO 2.0. Colored points and vertical dashed lines indicate the median value for each distribution. Statistical significance under a two-sided Kolmogorov–Smirnov test of the matched kcat distributions when compared to all entries for S. cerevisiae and fungi, is shown with red circles and stars, respectively. P-values below 1 × 10⁻² are indicated with red. Computed P-values are 0.538 for the comparison between GECKO2 vs. all fungi, 2.7 × 10⁻³ for GECKO2 vs. S. cerevisiae, 3.9 × 10⁻⁸ for GECKO vs. all fungi and, 2.1 × 10⁻¹¹ for GECKO vs. the S. cerevisiae entries. g Prediction of batch maximum growth rates on diverse media with ecYeast7 enhanced by GECKO 2.0. Glu—glucose, Fru—fructose, Suc—sucrose, Raf— raffinose, Mal—maltose, Gal—galactose, Tre—trehalose, Gly—glycerol, Ace—acetate, Eth —ethanol. Source data are provided in Source Data: Data Source file 1.

