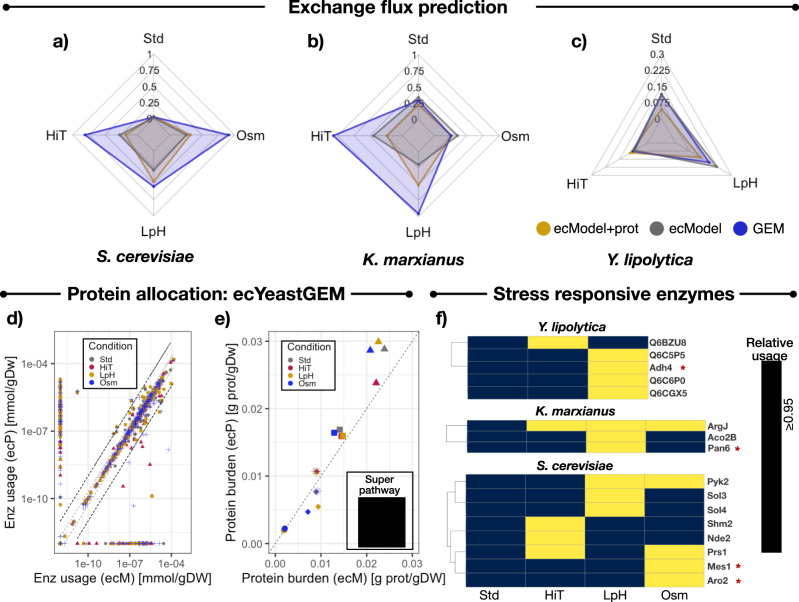
Fig. 4. Evaluation of proteomics-constrained ecModels.
Comparison of median relative error in prediction of exchange fluxes for O2 and CO2 by GEMs, ecModels and proteomics-constrained ecModels across diverse conditions (chemostat cultures at 0.1 h−1 dilution rate) for a S. cerevisiae, b K. marxianus, c Y. lipolytica. d Comparison of absolute enzyme usage profiles [mmol/gDw] predicted by ecYeastGEM (ecM) and ecYeastGEM with proteomics constraints (ecP) for several experimental conditions. The region between the two dashed gray lines indicates enzyme usages predicted in the interval 0.5 2, the region between the two dashed black lines indicates enzyme usages predicted in the interval 0.1 10, when comparing the two ecModels. e Protein burden for different superpathways predicted by ecYeastGEM (ecM) and ecYeastGEM with proteomics constraints (ecP). f Highly saturated enzymes at different stress conditions for S. cerevisiae, K. marxianus, and Y. lipolytica predicted by their corresponding ecModels constrained with proteomics data. Yellow cells indicate condition-responsive enzymes ( ≥ 0.95). Red asterisks indicate enzymes conserved as single copy orthologs across the three yeast species. Std—Reference condition, HiT—high-temperature condition, LpH—Low pH condition, Osm—Osmotic stress condition, AA—amino acid metabolism, NUC—nucleotide metabolism, CEM—central carbon and energy metabolism, CofVit—cofactor and vitamin metabolism, Lip—lipid and fatty acid metabolism. Source data are provided in Source Data: Data Source File 2.

