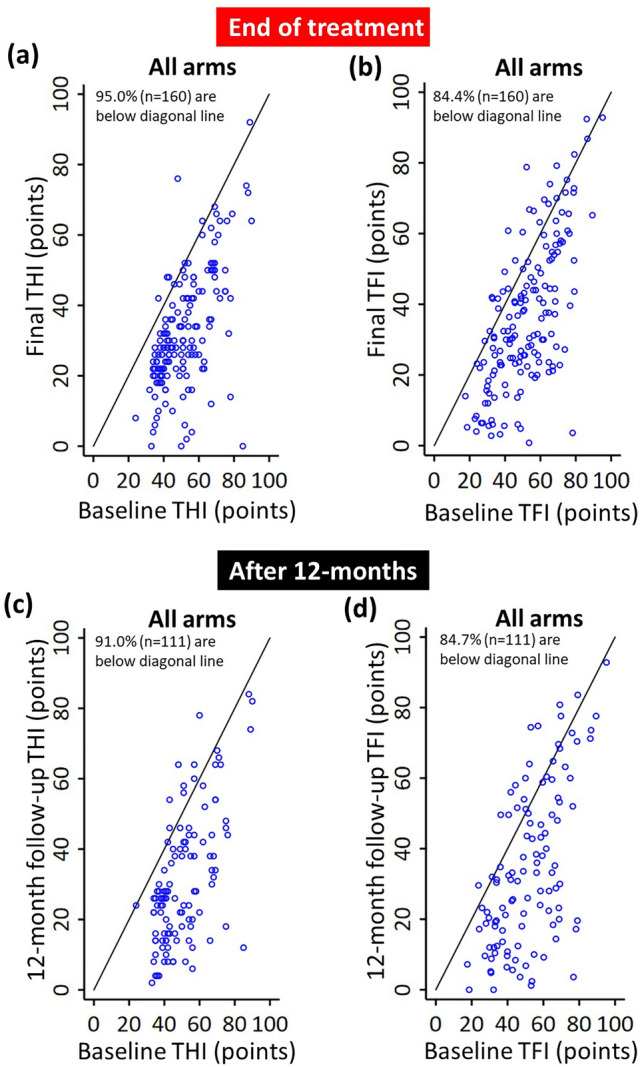
Figure 8.

Long-term clinical efficacy of bimodal neuromodulation. (a,b) Scatter plots of THI or TFI scores are shown that include each treatment-compliant individual at baseline versus end of treatment (12-week final visit) for all arms pooled together to represent bimodal neuromodulation in general. (c,d) Scatter plots of THI or TFI scores are shown that include each treatment-compliant individual at baseline versus 12-month post-treatment visit for all arms pooled together. All individuals who completed at least the assessments displayed in each figure were included to maximize the total number of subjects plotted in each figure, leading to a large sample size for each plot. Compliance to treatment is defined as ≥ 36 h treatment at final. Data points are jittered for visibility.
