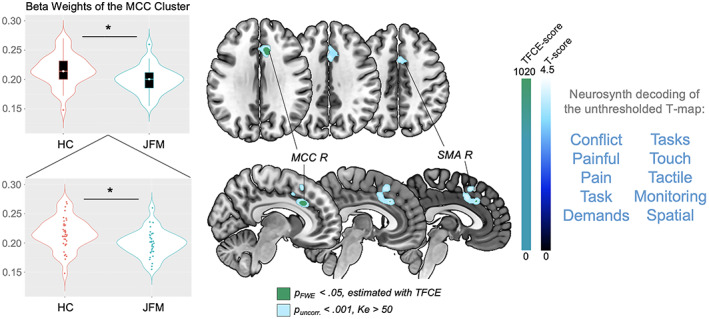
Figure 1.

Regions of significantly reduced gray matter volume (GMV) in adolescents with juvenile fibromyalgia (JFM) compared to healthy controls (HCs). Left, Violin plots of the beta weights of the anterior midcingulate cortex (aMCC) cluster in healthy controls and patients with juvenile FM. In the top panel, each box represents the 25th to 75th percentiles. Lines inside the boxes represent the median. Lines outside the boxes represent the 10th and 90th percentiles. Circles indicate outliers. In the bottom panel, circles indicate individual subjects. * = P < 0.01. Middle, Brain maps showing significant between‐group GMV differences (contrast: juvenile FM patients < healthy controls). Results are presented at a significance level of family‐wise error corrected P (P FWE‐corr) < 0.05, estimated using the threshold‐free cluster enhancement (TFCE) approach, and uncorrected P (P uncorr) < 0.001 with a cluster extent (Ke) >50 voxels. Right, The 10 functional annotations most associated with the unthresholded t‐map, obtained by meta‐analytic decoding using Neurosynth. R = right; SMA = supplementary motor area.
