
Extended Data Fig. 12. CTL transfer model during L. monocytogenes infection.
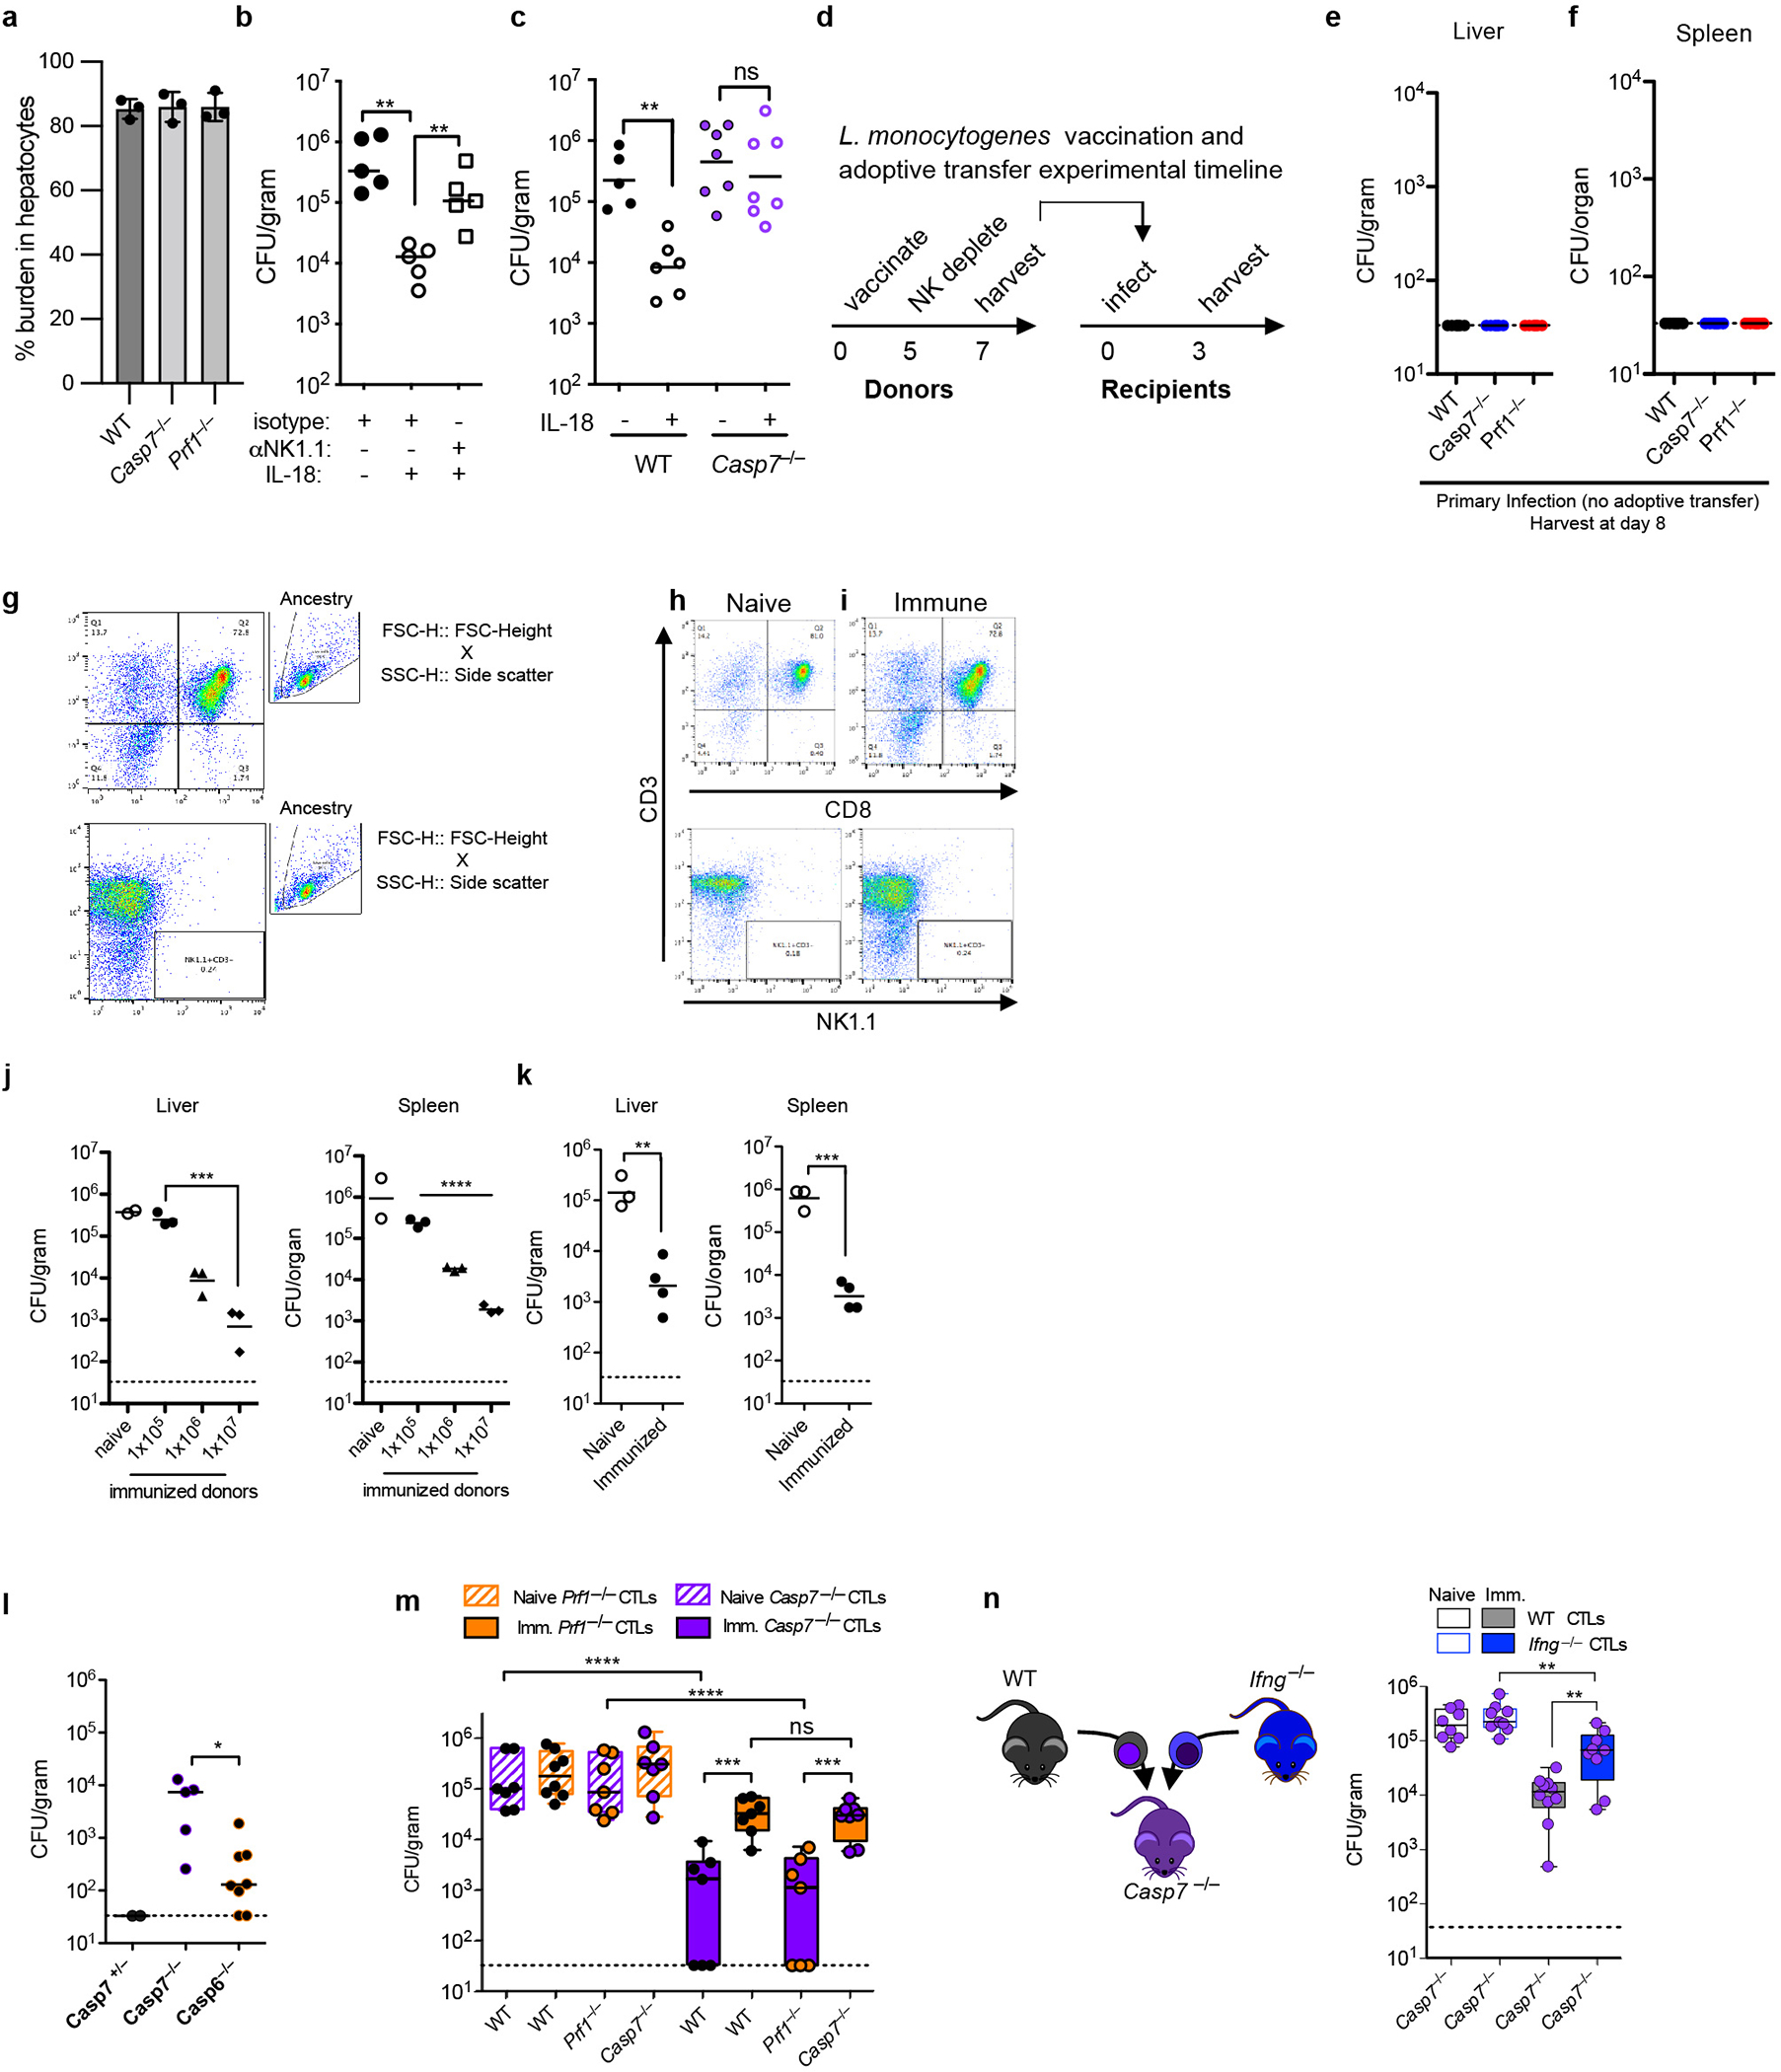
a, Percentage of bacterial burden localized to hepatocytes 3 days post infection. Equal weight liver sections were removed and the hepatocyte fraction was graphed as a percentage of the total burden by weight. 3 mice per genotype. b-c, Mice were infected IV with 5×10³ L. monocytogenes and IP treated with combinations of isotype antibody or NK depleting antibody (100 μg anti-NK1.1 PK136), with IL-18 (0.2 μg recombinant mouse IL-18) or isotype control as indicated. Mouse numbers (b) n=5 each group; (c) WT PBS n=6, WT IL-18 n=6, Casp7−/− n=7 each. d, Timeline for adoptive transfers. Donor mice were PBS treated (naïve) or vaccinated with 1×10⁶ ΔactA L. monocytogenes (immune). e-f, Liver and splenic burdens 8 days post primary infection with 5×10³ L. monocytogenes. n=6 mice each. g, Flow gating strategy for flow experiments depicted in (h-i). h-i, Donor mice were NK depleted (> 99% eliminated) and their CTLs enriched by negative selection (> 72% purity). j, Mice were adoptively transferred with the indicated numbers of purified CTLs (naïve were given 1×10⁷ as the maximum transferred number), infected with 5×10⁴ L. monocytogenes and bacterial burdens were analyzed in the liver and spleen 3 days post infection. 2 naïve mice, 3 per immunized group. k, Bulk splenocyte transfer (5×10⁷, as previously described in 23) with NK depletion was comparable to that of isolated CTLs. Naïve n=3, immunized n=4 mice. l, Mice were infected with 5×10⁴ of L. monocytogenes and adoptively transferred with immunized WT CTLs as in d. Liver bacterial burdens were determined 3 days post infection. Mouse numbers: Casp7+/− (n=2F), Casp7−/− (n=3M+2F), and Casp6−/− (n=5F+3M). Note full clearance in Casp7+/− mice may be due to gender disparities or simply to low numbers leading to stochasticity and poor sampling. m-n, Donor mice were PBS treated (naïve) or vaccinated with 1×10⁶ ΔactA L. monocytogenes (immune). (m) Adoptive transfer data from Figure 5b–c are shown on the same graph, since all the transfers were done in the same 2 pooled experiments. Numbers of mice (m) WT mice with Casp7−/− CTLs n=7 each, naïve Prf1−/− CTLs n=8, immune Prf1−/− CTLs n=7; naïve knockout recipients n=7 each, immune recipients Prf1−/− n=8, Casp7−/− n=7; (n) naïve WT n=8, immune WT n=10, Ifng−/− n=9 each. Data are representative of two experiments (a, e-f, h) or pooled from two experiments (b-c, j-n). *P < 0.05, **P < 0.01, ***P < 0.001, ****P < 0.0001 (Two-sided Mann-Whitney U test (a-c, k, l), or (j, m, n) one way ANOVA with Tukey’s multiple comparison test). Bars indicate mean with standard deviation (a). Box plots show median, 25th-75th percentile, whiskers are minimum and maximum. Exact p and n values in Source Data EDF12.