
Extended Data Figure 13. CTL transfer induces cleavage of caspase-7 during L. monocytogenes infection.
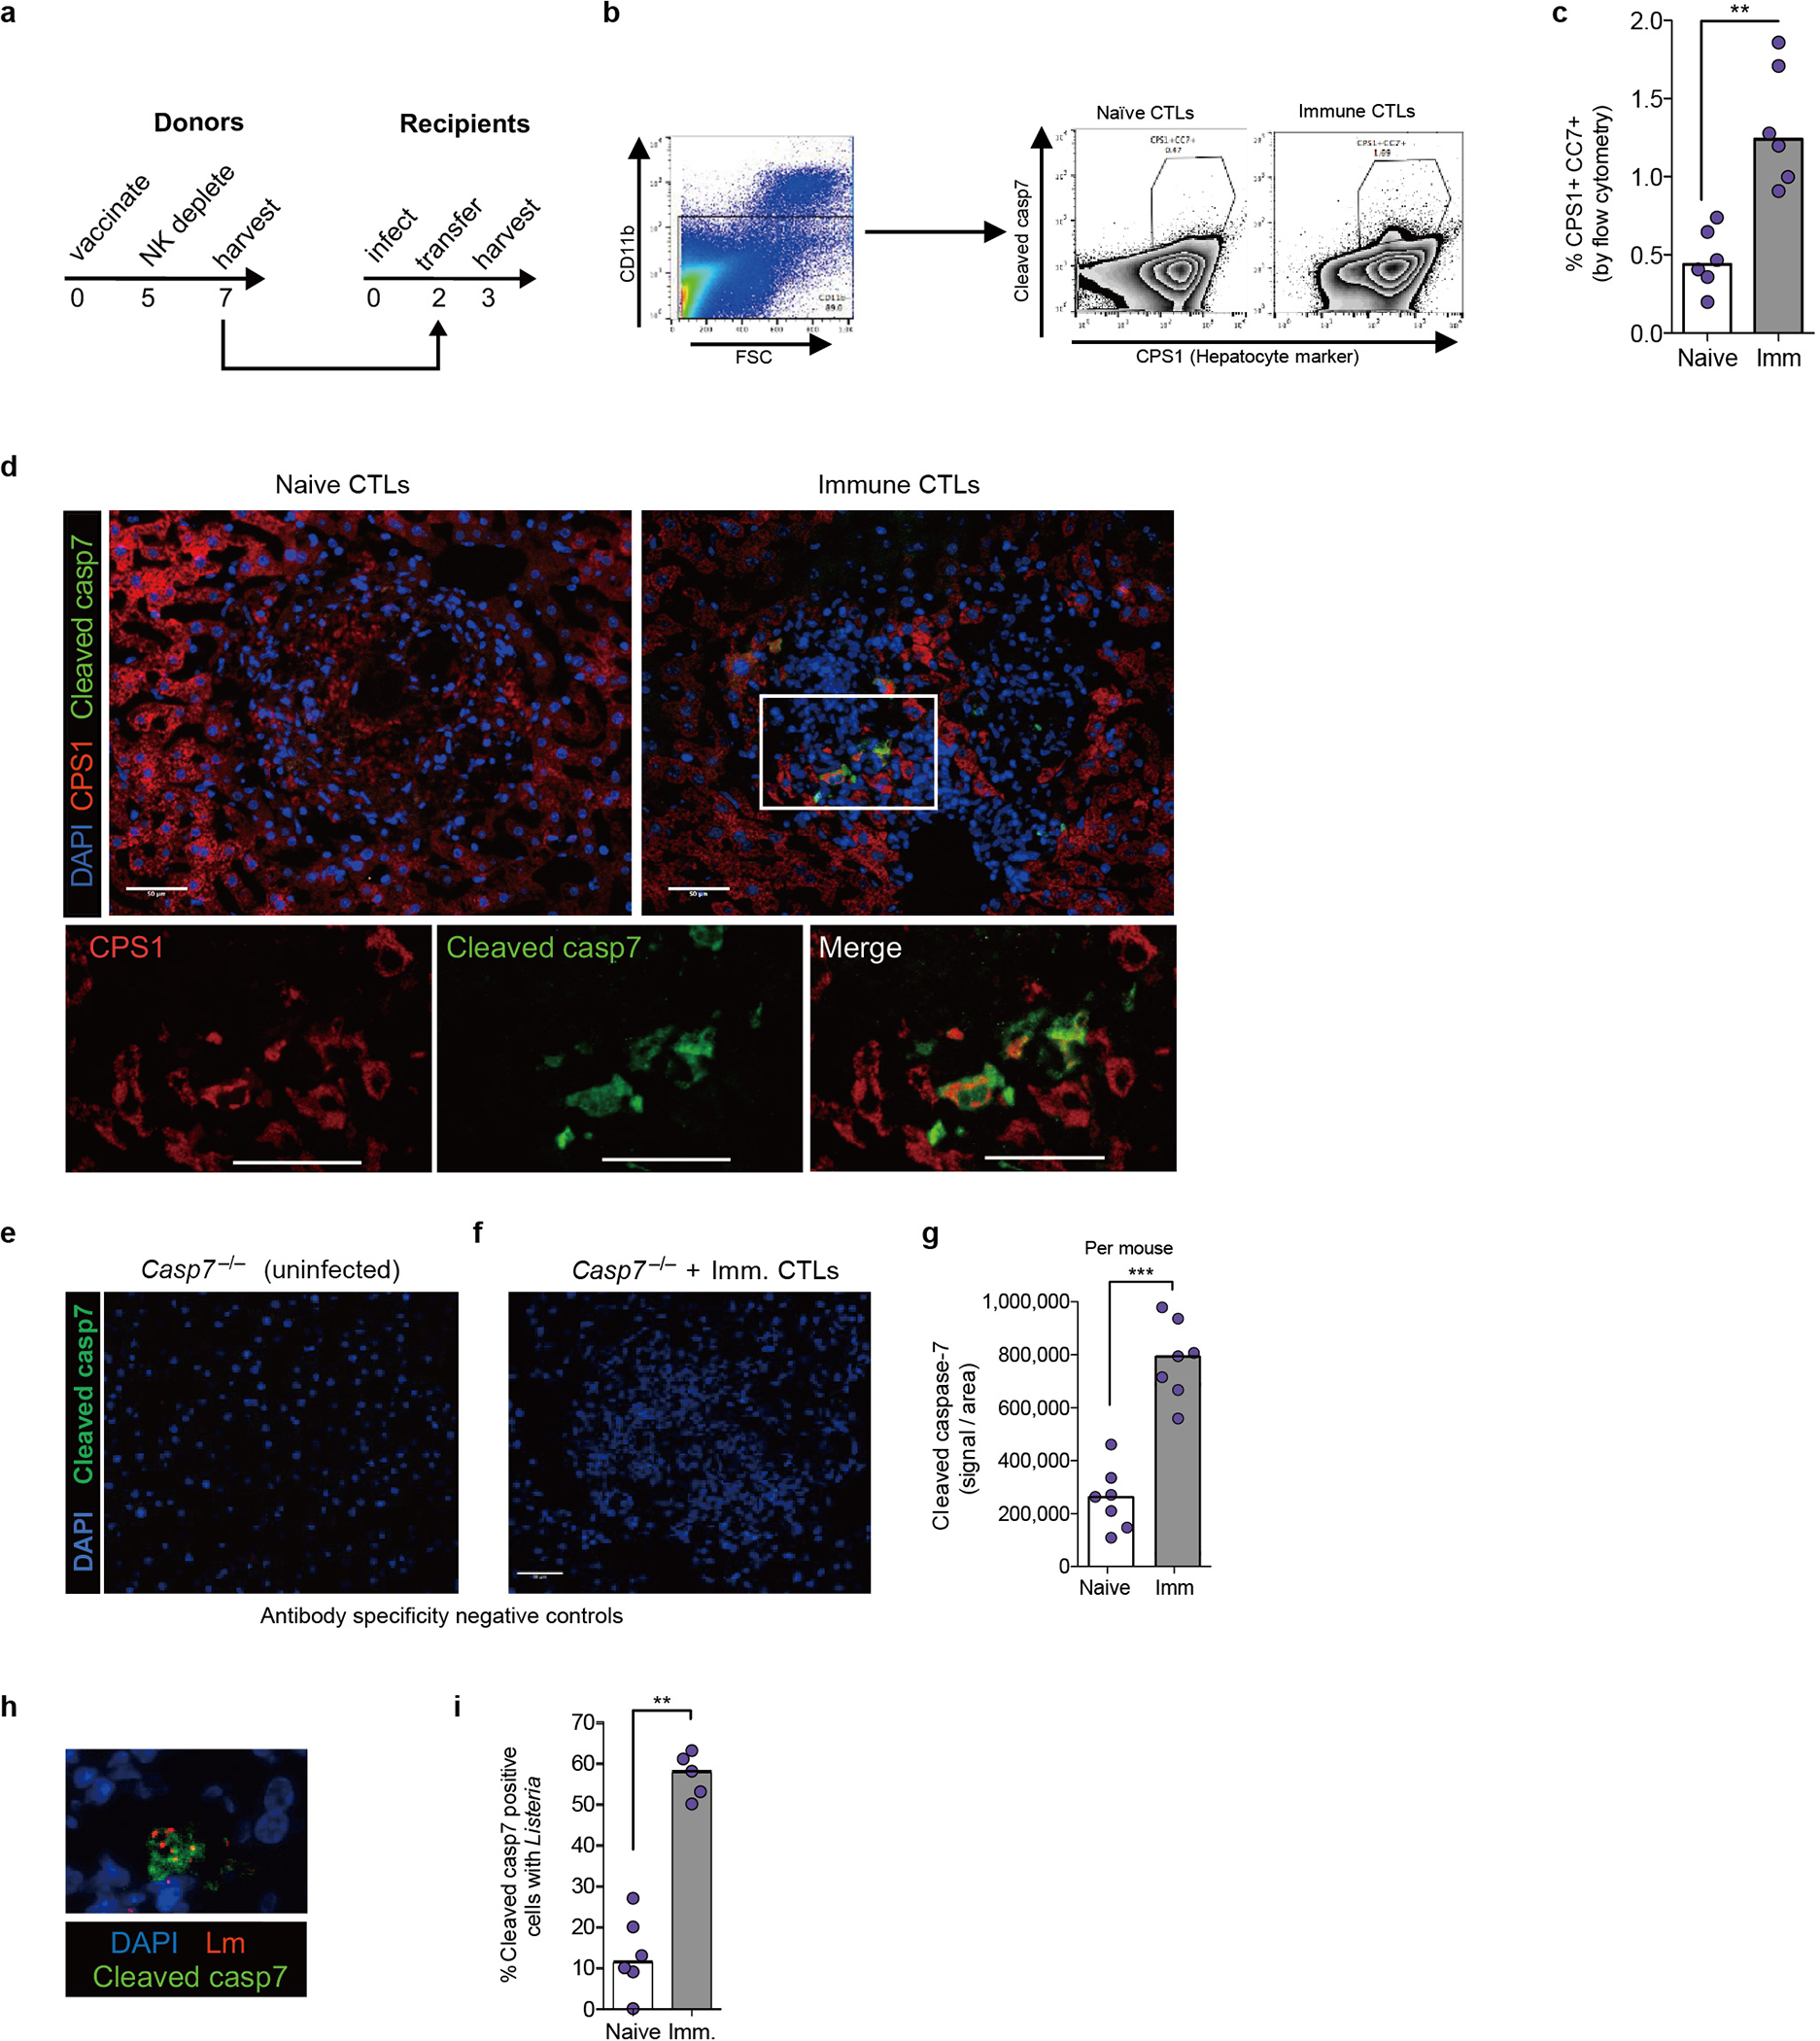
a, Timeline for adoptive transfers with recipients infected IV with 5×10⁴ L. monocytogenes in Figure 5. b-c, Flow cytometry of enriched hepatocytes for cleaved caspase-7 staining and gating scheme, with representative plot (b) and quantification of n=6 mice per group (c). d, Representative images of livers stained for nuclei (DAPI; blue), cleaved caspase-7 (green), and CPS1 (red). Scale bars, 50 μm. e-f, Immunofluorescence control staining. Casp7−/− mice were left uninfected (e) or CTL transferred and infected with 5×10⁴ L. monocytogenes (f), and harvested 3 days post infection. Representative images of livers stained for nuclei (DAPI; blue) and cleaved caspase-7 (green). Scale bars, 50 μm. g, Quantification of cleaved caspase-7 signal within lesions (dot = average per mouse; n=7 WT mice per group). h-i, Colocalization of cleaved caspase-7 signal and L. monocytogenes with representative image (h) and quantification (i) from n=6 naïve and n=5 immune WT mice. Scale bar, 50 μm. Graphed data are pooled from 2 experiments (c, g, i). Images representative of 2 experiments (d, h) or one experiment (e, f). * P < 0.05, **P < 0.01, ***P < 0.001, ****P < 0.0001 (Two-sided Mann-Whitney U test). Bars indicate median values. Exact p and n values in Source Data EDF13.