
Figure 2. Caspase-7 activation drives ASM to repair gasdermin D pores and facilitate IEC extrusion.
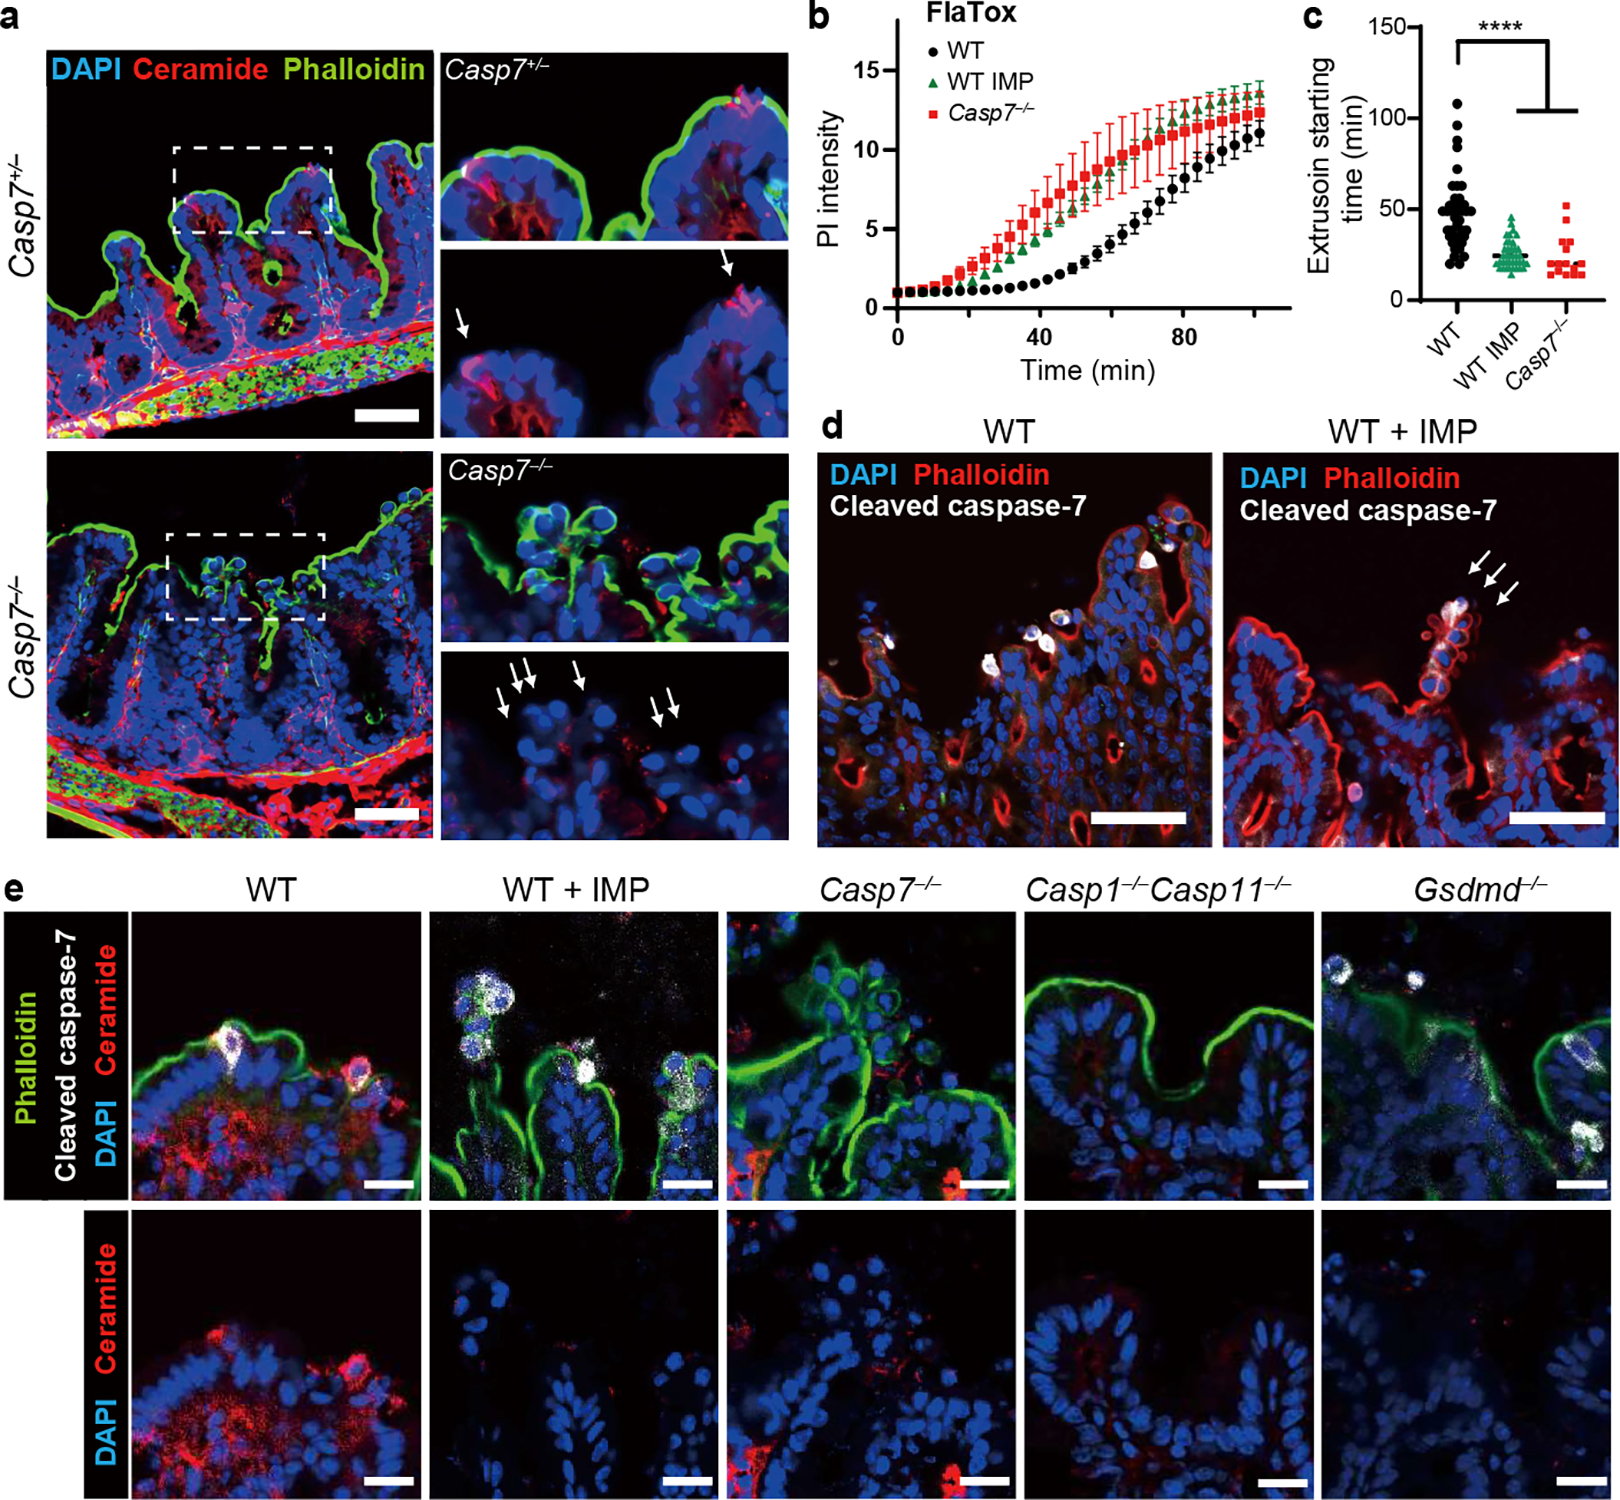
a, Indicated mice were infected with 5×10⁶ S. Typhimurium and ceca harvested 24 hours later. (a) Ceramide staining; dotted rectangles shown at higher magnification at right (➝ indicates individual extruding cells). b-c, Indicated organoids treated with FlaTox were live-imaged, and PI intensity (b) or (c) extrusion starting time were quantitated. d-e, Indicated mice were infected with 5×10⁶ S. Typhimurium and ceca harvested 24 hours later. (d) Cleaved caspase-7 staining (➝ indicates extruding cell clusters). (e) Ceramide and cleaved caspase-7 staining. Scar bar = 50 μm (a, d) or 20 μm (e). Data are representative of 3 experiments (a, d, e) or are pooled from 3 experiments (b-c). For (c), WT (n=41), WT+IMP (n=39), and Casp7−/− (n=15) organoids pooled from 3 experiments were analyzed. *P<0.05, **P<0.01, ***P<0.001, ****P<0.0001 (Two-way ANOVA with Tukey’s post-hoc test in (b), one-way ANOVA with Tukey’s post-hoc test in (c)). Data are shown as mean ± SEM. Exact p values in Source Data F2.