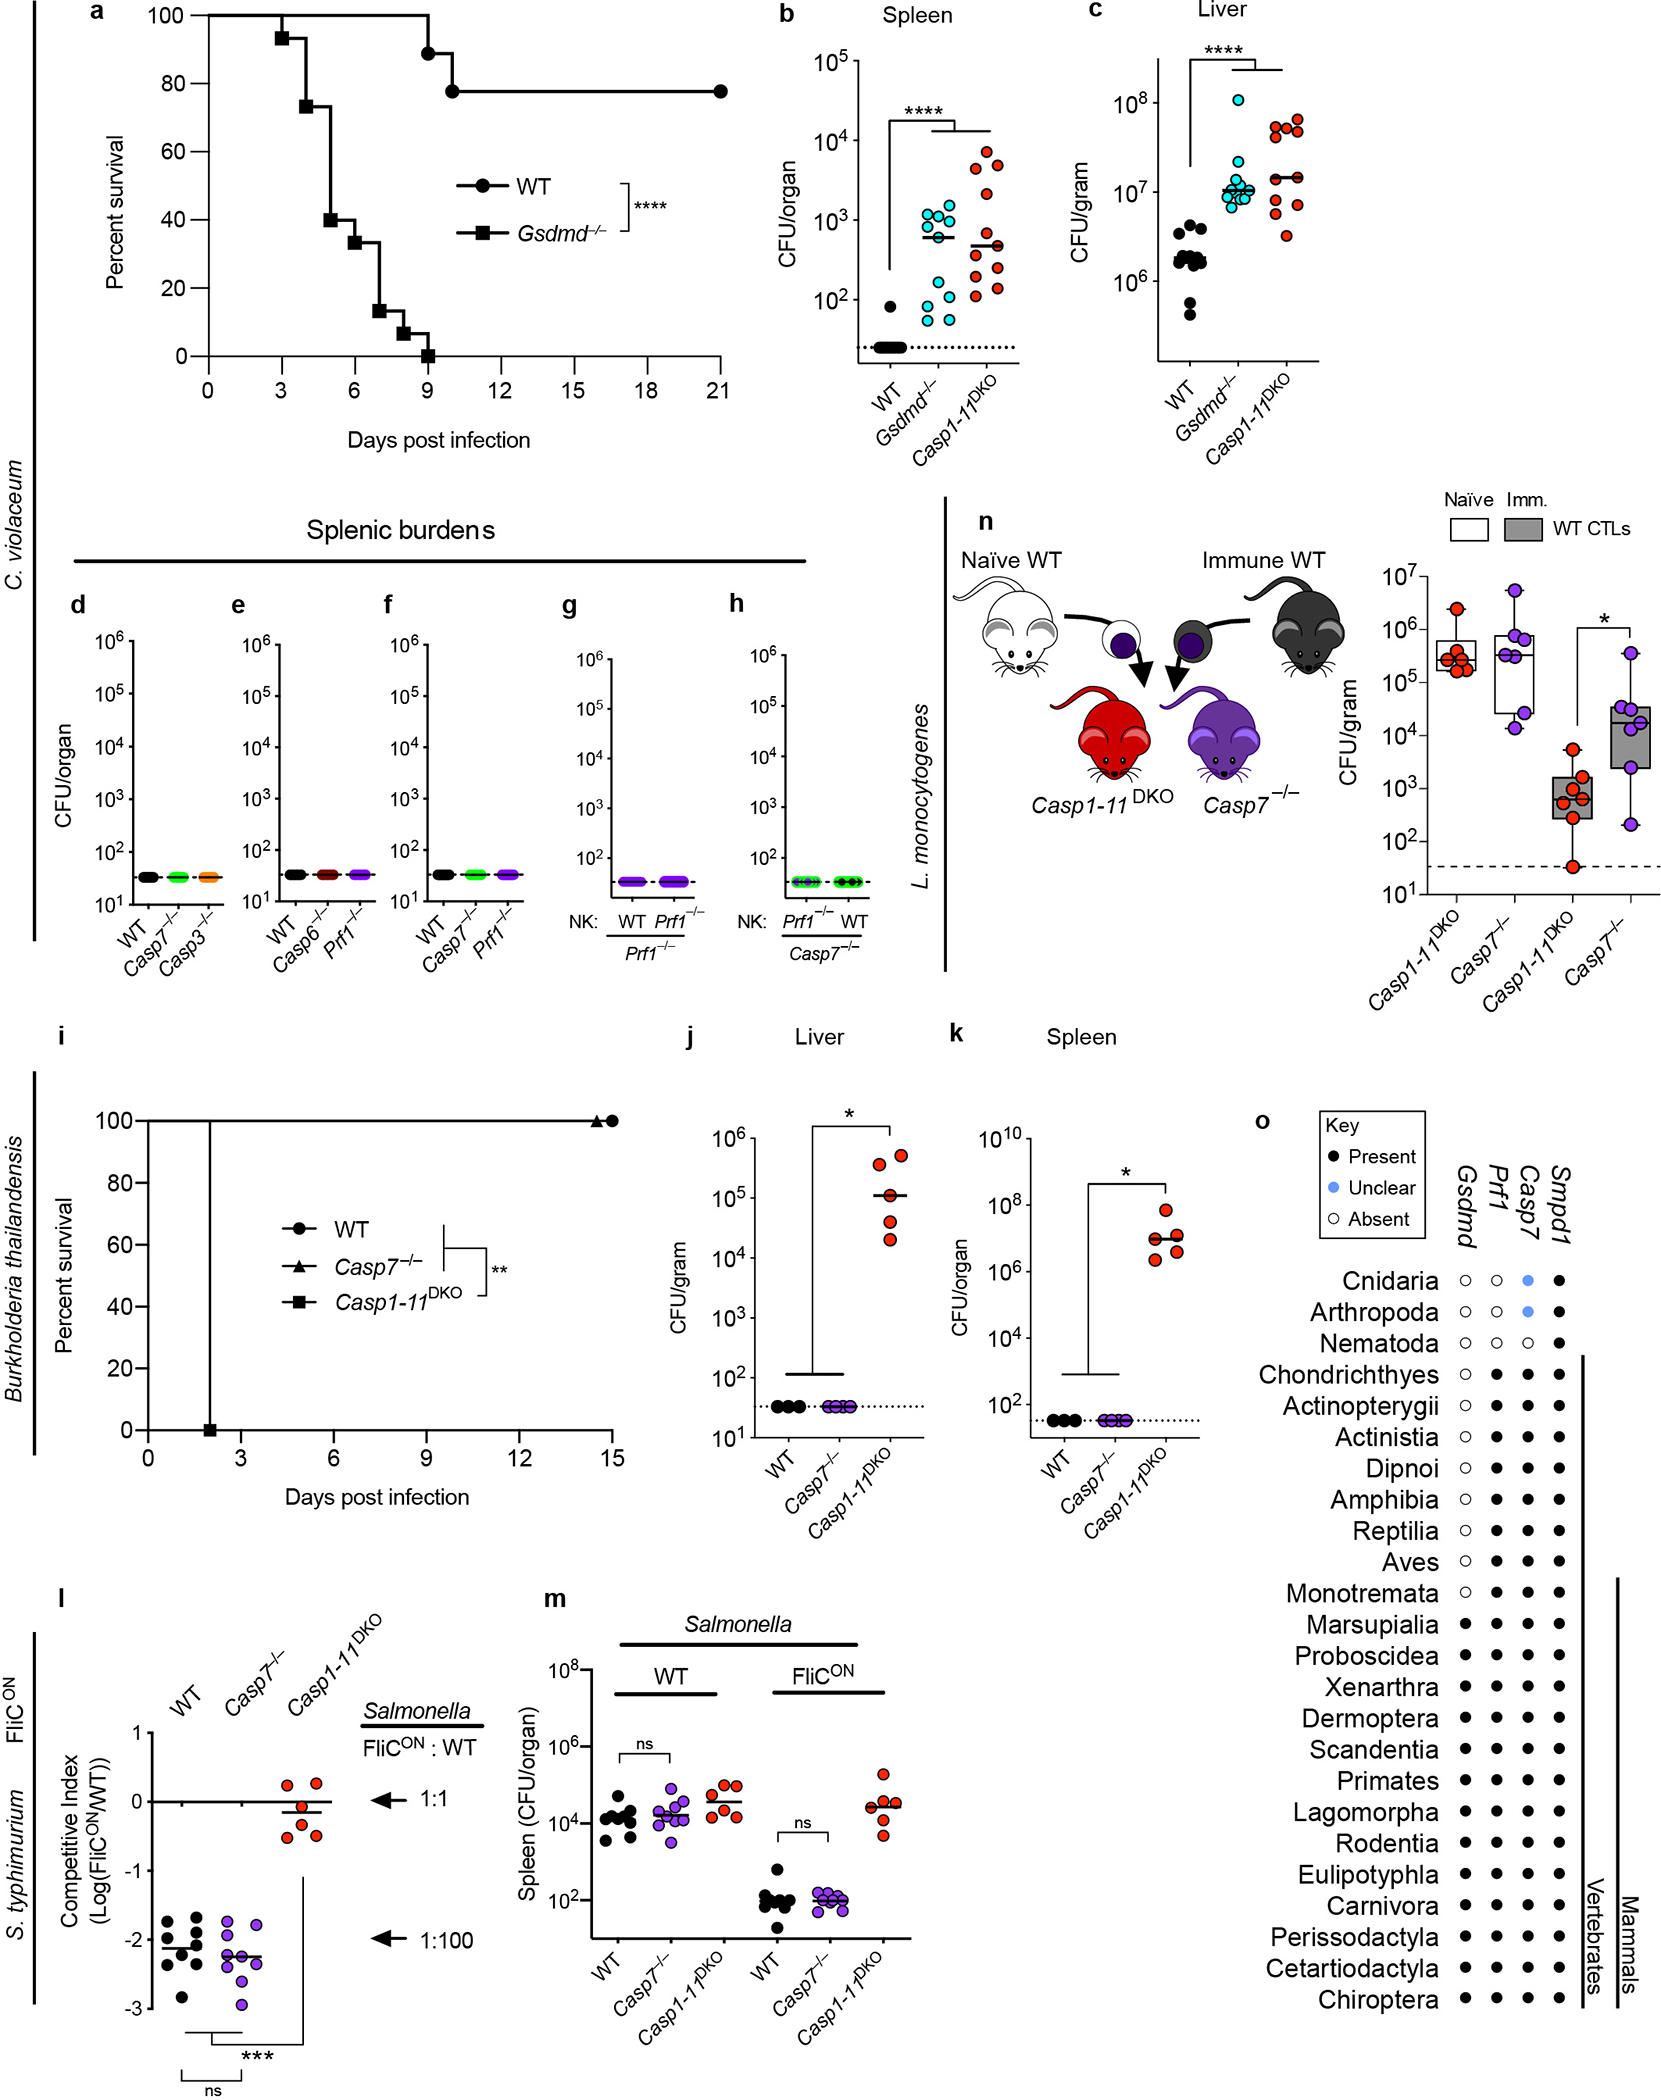
Extended Data Fig. 16. Pyroptotic activation of caspase-7 is not required for clearance of C. violaceum.

a-c, Mice were infected IP with 1×10⁴ C. violaceum and monitored for survival (a) or harvested for bacterial counts 2 days post infection (dpi) (b-c). d-h, Mice were infected with C. violaceum and spleen burdens determined 3dpi; spleen burdens shown are from the same mice whose liver burdens are shown in Extended Data Fig. 9a, Fig. 4a–b, and Fig. 4d–e. i-k, Mice were infected IP with B. thailandensis at 2×10⁷ (i) or 1×10⁴ CFUs (j-k) and mice were monitored for survival (i) or bacterial burdens were enumerated 3 dpi (j-k). l-m, Mice were infected IP with 1×10⁵ total S. typhimurium (5×10⁴ of WT plus 5×10⁴ of FliCON), with bacterial burdens determined 2 dpi and burdens graphed as competitive index (CI) of FliCON to WT bacteria (l) or graphed as total burdens (m). n, Liver bacterial burdens 3 dpi with 5×10⁴ L. monocytogenes, with adoptive transfer schematic. Donor mice were PBS treated (naïve) or vaccinated with 1×10⁶ ΔactA L. monocytogenes (immune). O, Presence or absence of Smpd1 (encoding ASM), Casp7, Prf1, and Gsdmd in the indicated taxonomic groups were determined by gene annotation and verified by reciprocal BLAST searches against the respective mouse gene product. Data are pooled from three experiments (a-c), pooled from two experiments (d-h, l-n) or representative of two experiments (i-k). Mouse numbers (a) n=9 WT, n=15 Gsdmd−/−; (b-c) n=12 WT, n=11 Casp1−/−Casp11−/−, n=11 Gsdmd−/−; (i) n=5 WT, n=3 Casp1−/−Casp11−/−, n=5 Casp7−/−; (j-k) n=3 WT, n=4 Casp7−/−, n=5 Casp1−/−Casp11−/−; (l-m) n=9 WT, n=9 Casp7−/−, n=6 Casp1−/−Casp11−/−; (n) n=6 naïve Casp1−/−Casp11−/−, n=7 immune Casp1−/−Casp11−/−, n=7 each Casp7−/−. *P < 0.05, **P < 0.01, ***P < 0.001, ****P < 0.0001 (Two-sided Mann-Whitney U test, or (a, i) log-rank Mantel-Cox test). Bars indicate median values. Box plots show median, 25th-75th percentile, whiskers are minimum and maximum. Exact p and n values in Source Data EDF16.
