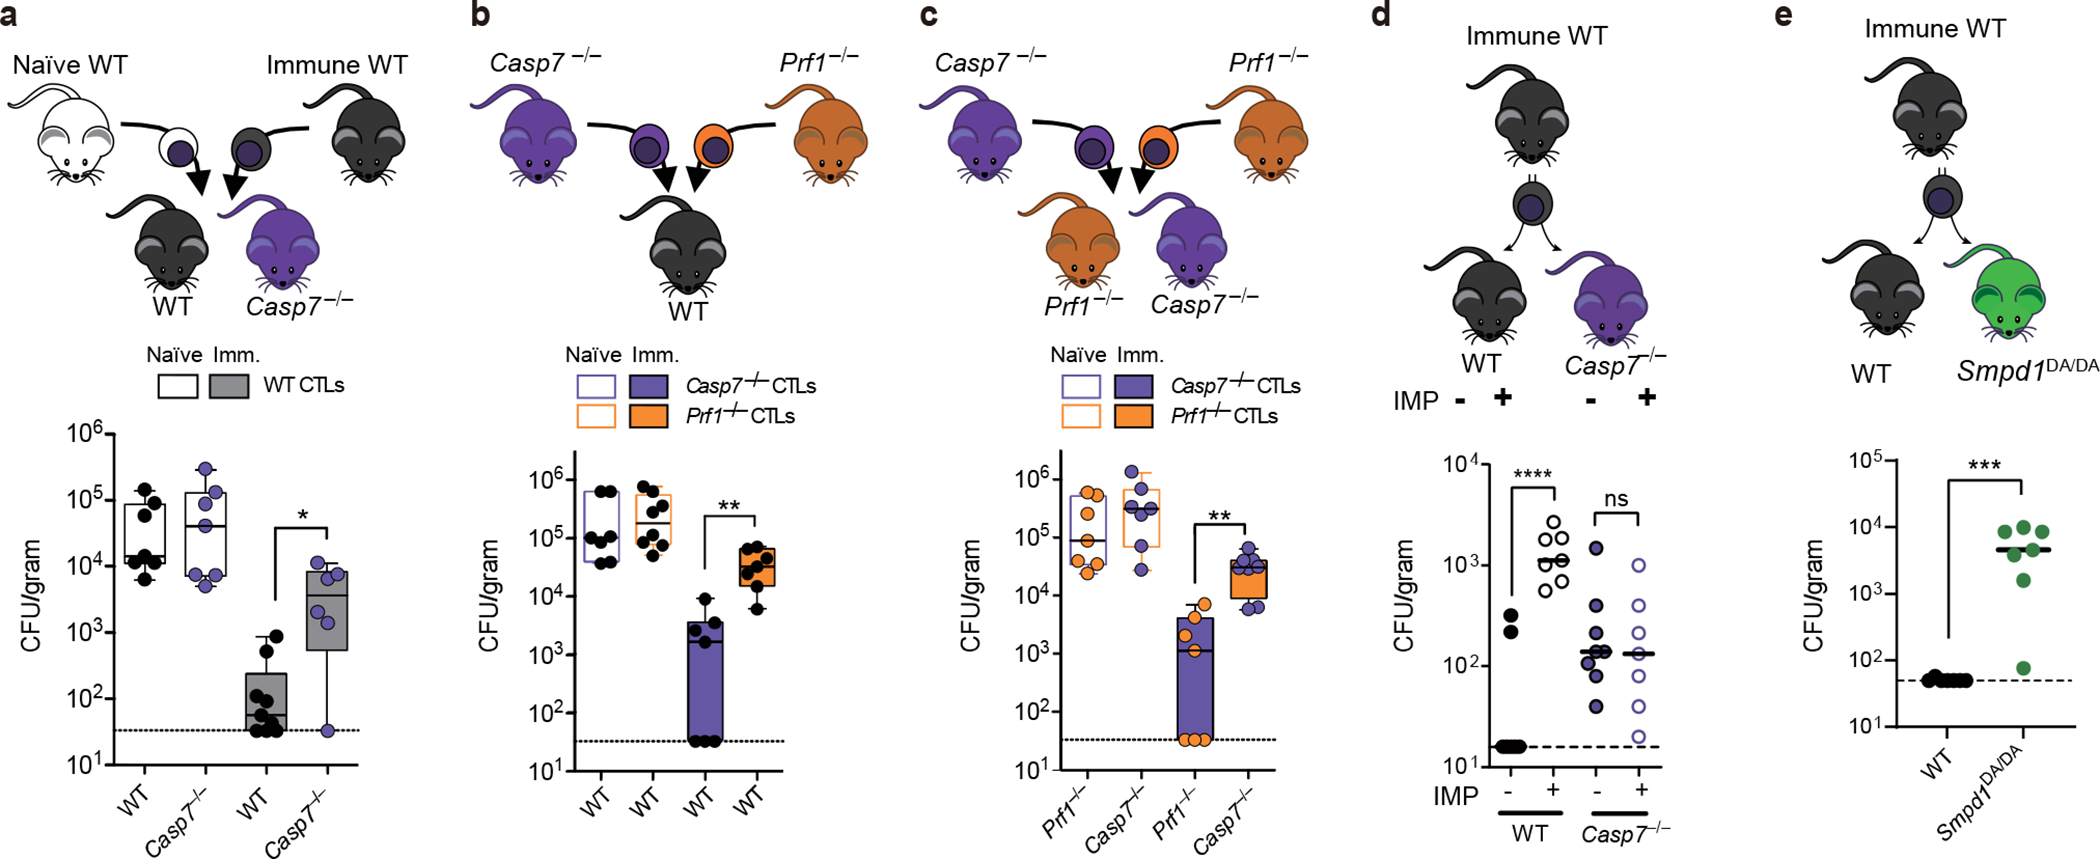
Figure 5. CTL perforin attack clearance of L. monocytogenes requires caspase-7 and ASM cleavage.

a-e, CTL donor mice were PBS treated (naïve) or vaccinated with ΔactA L. monocytogenes (immune). Recipient mice were infected with L. monocytogenes, transferred with CTLs 2 days post infection (dpi), and liver burdens determined 3 dpi. Timeline for AT experiments in EDF13a. d, Recipient mice were injected IP with imipramine or PBS (day −1 to infection, then daily). All data are pooled from two experiments. Mouse numbers in (a) naïve WT n=7, immune WT n=9, naïve Casp7−/− n=7, immune Casp7−/− n=6; (b) WT mice with Casp7−/− CTLs n=7 each, naïve Prf1−/− CTLs n=8, immune Prf1−/− CTLs n=7; (c) naïve recipients n=7 each, immune recipient Prf1−/− n=8, Casp7−/− n=7; (d) WT n=7, WT IMP n=7, Casp7−/−n=8, Casp7−/− IMP n=7; (e) WT n=7, Smpd1DA/DA n=7. *P<0.05, **P<0.01, ***P<0.001, ****P<0.0001 (Two-sided Mann-Whitney U test (a, e) or one-way ANOVA (b-d)). Bars indicate median values. Box plots show median, 25th-75th percentile, whiskers are minimum and maximum. Exact p values in Source Data F5.
