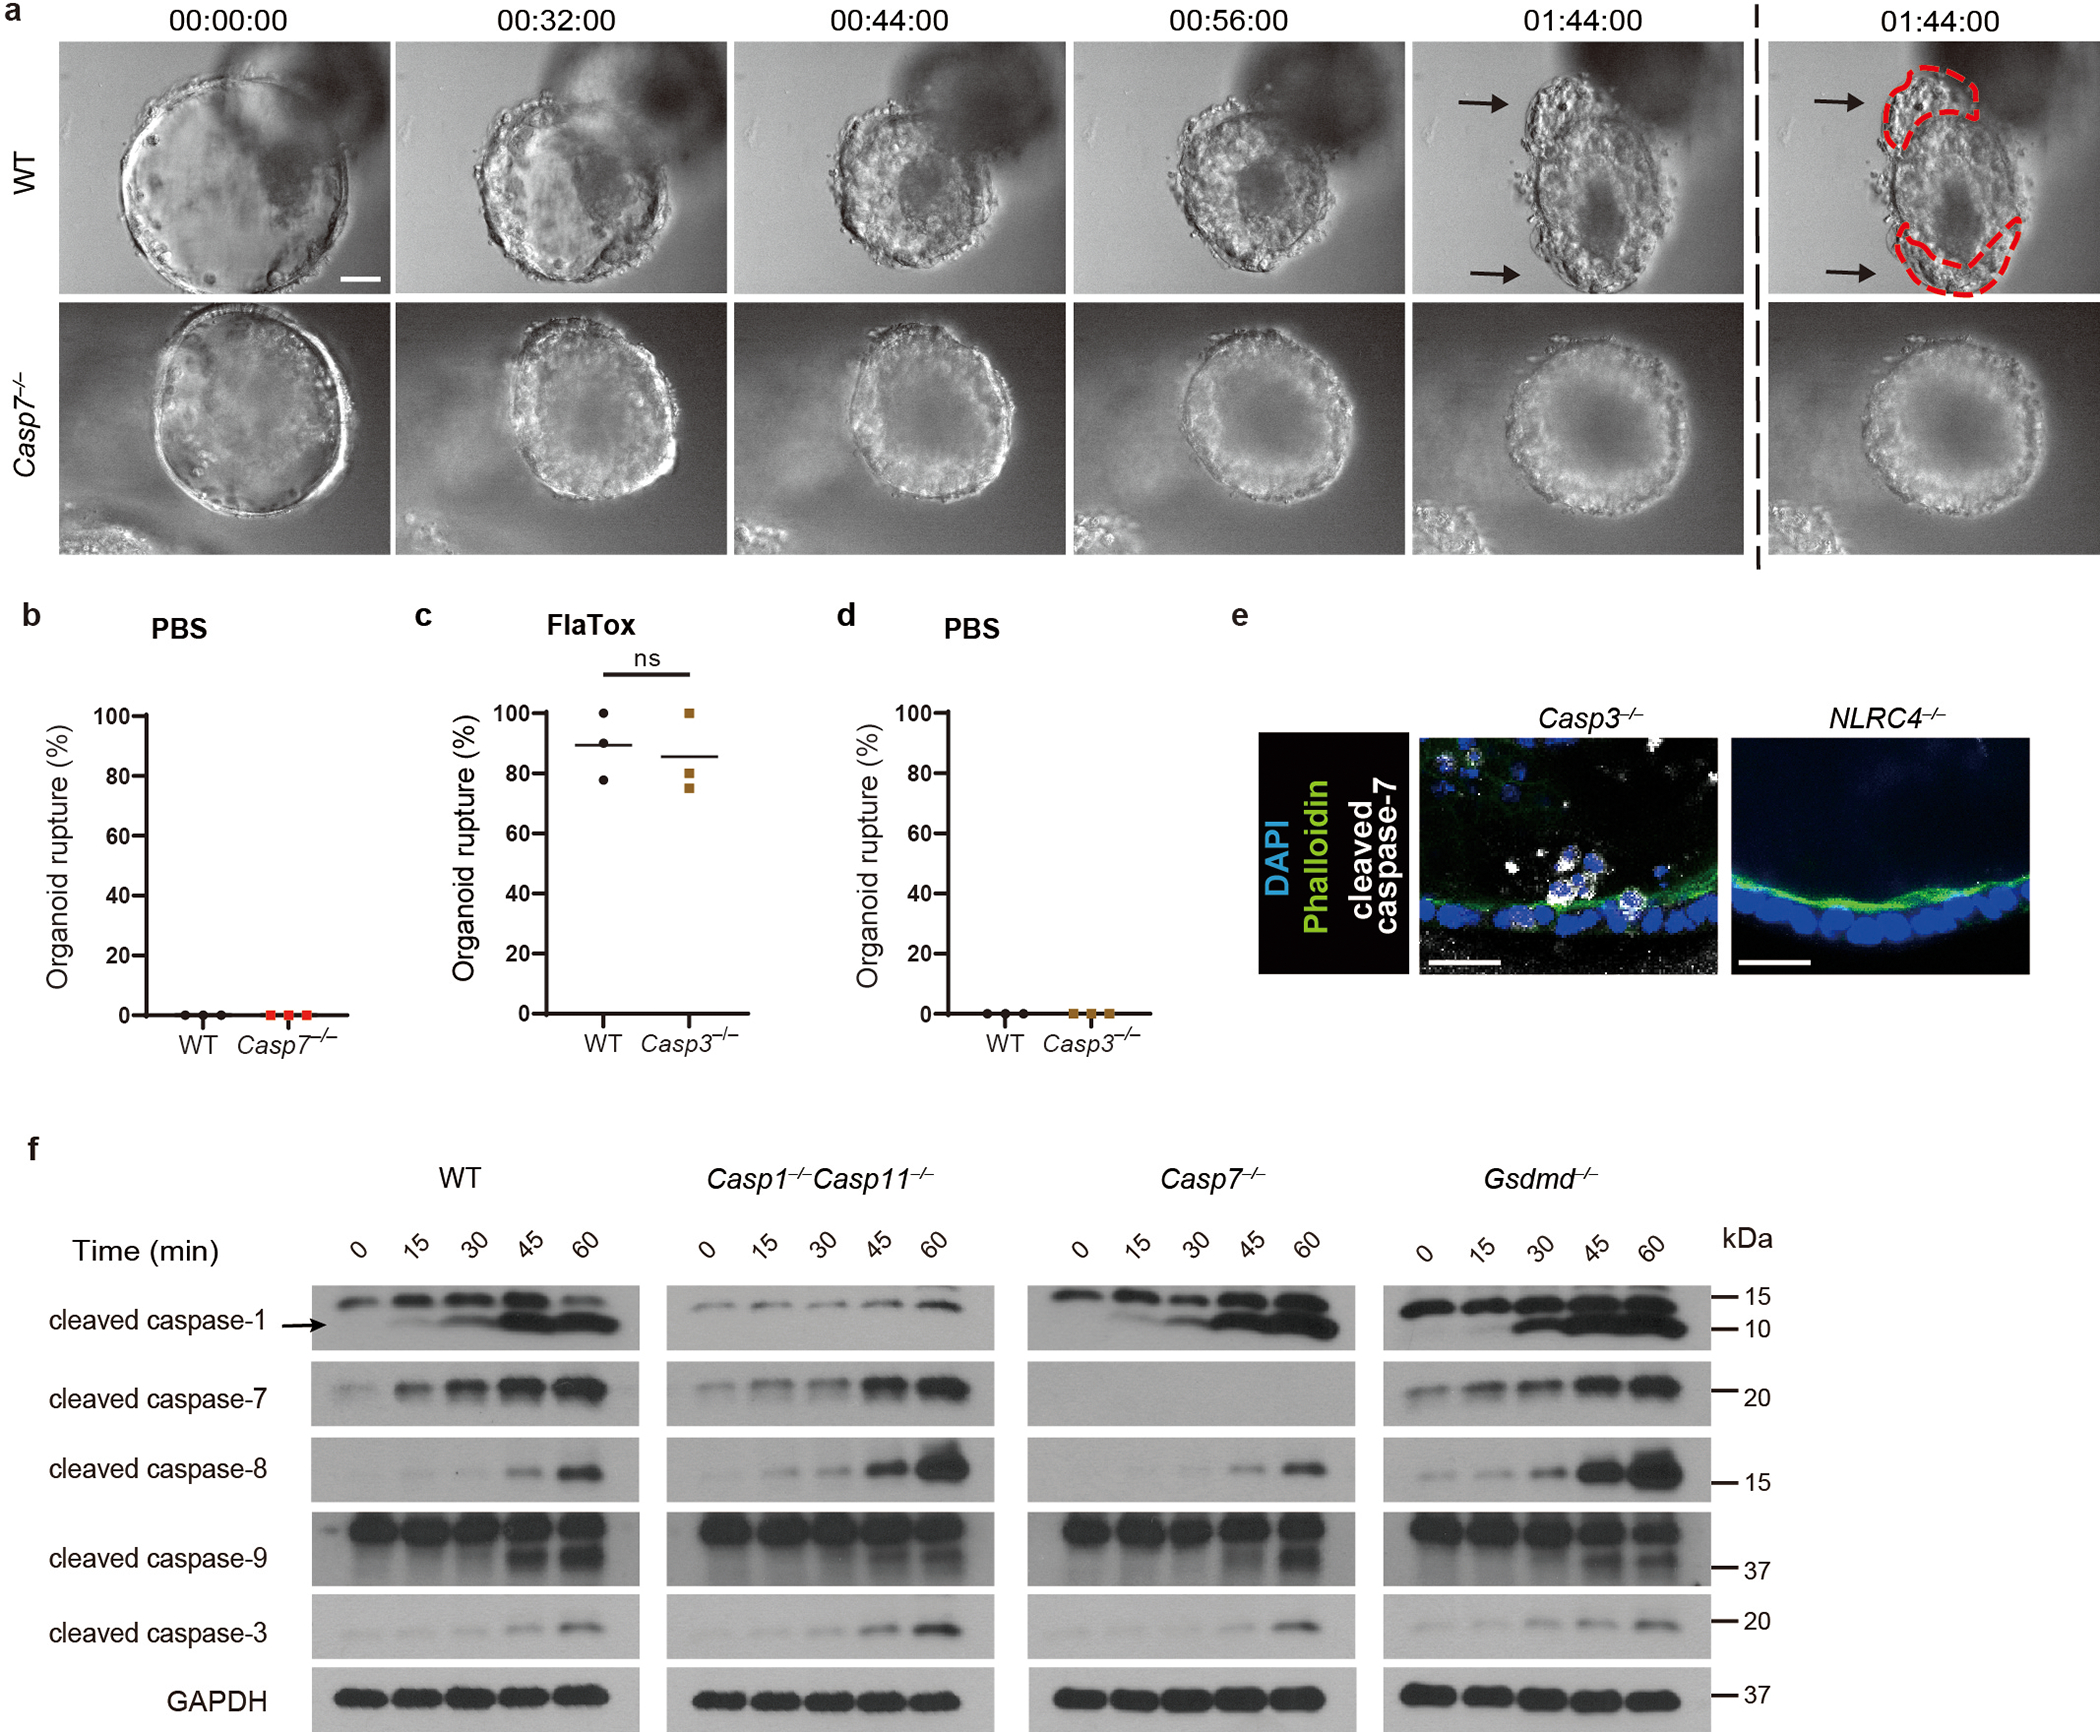
Extended Data Figure 2. Caspase-7 facilitates IEC extrusion after FlaTox treatment.

a, Representative images of WT and Casp7−/− organoids after FlaTox treatment in 12 pooled experiments. b, Percentage of ruptured WT and Casp7−/− organoids after PBS treatment in pooled live imaging experiments. c-d, Percentage of ruptured WT and Casp3−/− organoids after FlaTox (c) or PBS (d) treatment in pooled experiments. e, Representative images of indicated organoids 30 min after FlaTox treatment, stained with phalloidin and for cleaved caspase-7 (Related to Fig. 1d). f, Immunoblot of IEC organoids treated with FlaTox probed for the indicated caspases. Data are representative of 3 experiments (e, f) or pooled from 12 (a), or 3 (b-d) experiments. Scar bar = 20 μm. *P < 0.05, **P < 0.01, ***P < 0.001, ****P < 0.0001 (Two-sided unpaired t test). Data are shown as mean ± SEM. Exact p values available in Source Data EDF2.
