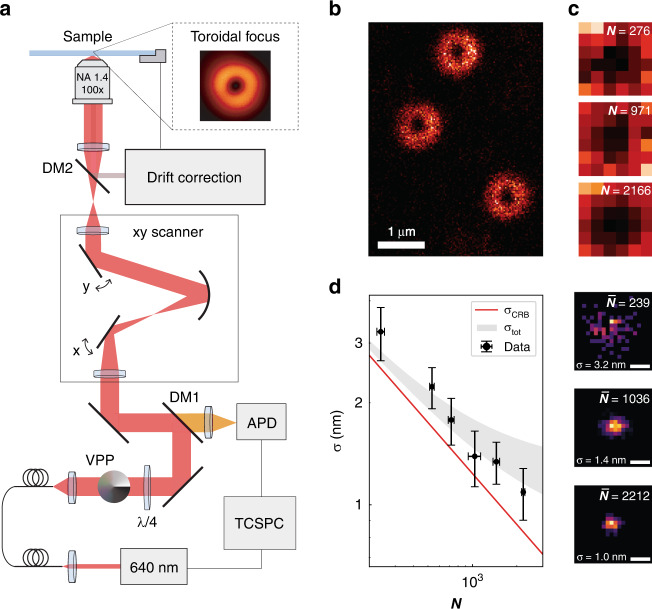
Fig. 2. Experimental implementation in a confocal microscope.
a Schematic representation of the optical setup used to perform RASTMIN. The setup is based on a standard home-built confocal microscope with an optical scanner. A vortex-phase plate in the excitation path and a drift correction system were added. The inset shows an image of the experimentally obtained toroidal focus. b Confocal image overview of the sample containing individual DNA origami with one fluorescent molecule each. c Exemplary RASTMIN frames obtained at different laser powers (3, 12, and 24 µW). The RASTMIN parameters were K = 6 × 6, L = 100 nm, frame time was 130 ms, and SBR was 4. d Localization precision achieved in RASTMIN measurements on single molecules (ATTO647N) with different photon counts. For each condition (N), three independent measurements were carried out, each one consisting of 100 localizations. For comparison, the theoretical σCRB(N) (solid line) and the predicted localization uncertainty for the experiments (, gray shaded area) are shown for σDC = 0.8–1.3 nm. The theoretical σCRB(N) was calculated in the central 10-nm part of the FOV. On the right, exemplary 2D histograms of localizations with average photon counts of and 2212. The corresponding localization uncertainties ( and nm) are also displayed. Scale bar in d: 5 nm

