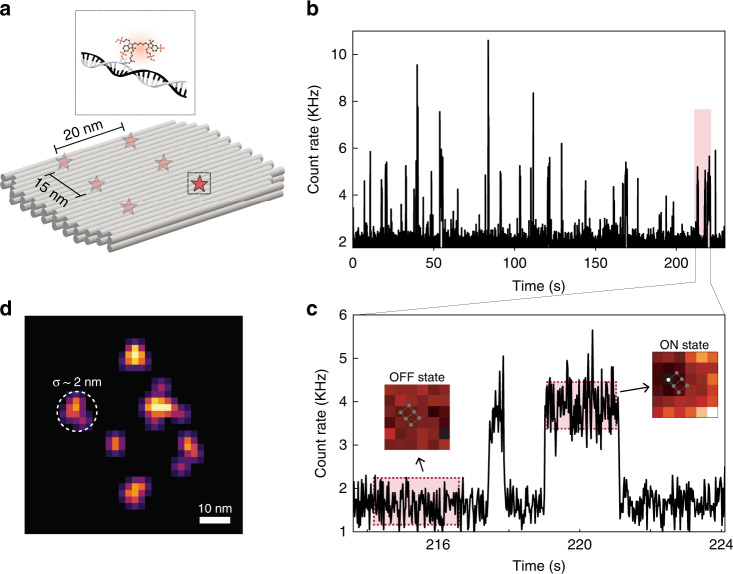
Fig. 3. RASTMIN nanoscopy.
a Schematic of the DNA origami used to place six fluorophores in a rectangular arrangement. b Fluorescence intensity time trace of representative 225 s of a RASTMIN measurement (frame time 20 ms) where single-molecule blinking events are detected. c Zoom-in of 10 s of the trace (highlighted region in b, 214–224 s) where two single-molecule emission events are observed. The inset images are the single-molecule 6 × 6 RASTMIN average frame corresponding to the periods highlighted in the time trace. During the single-molecule emission, a displaced image of a paraboloid is observed. d Reconstructed image of the DNA origami from the localizations obtained by RASTMIN, where a localization precision of nm can be observed ()

