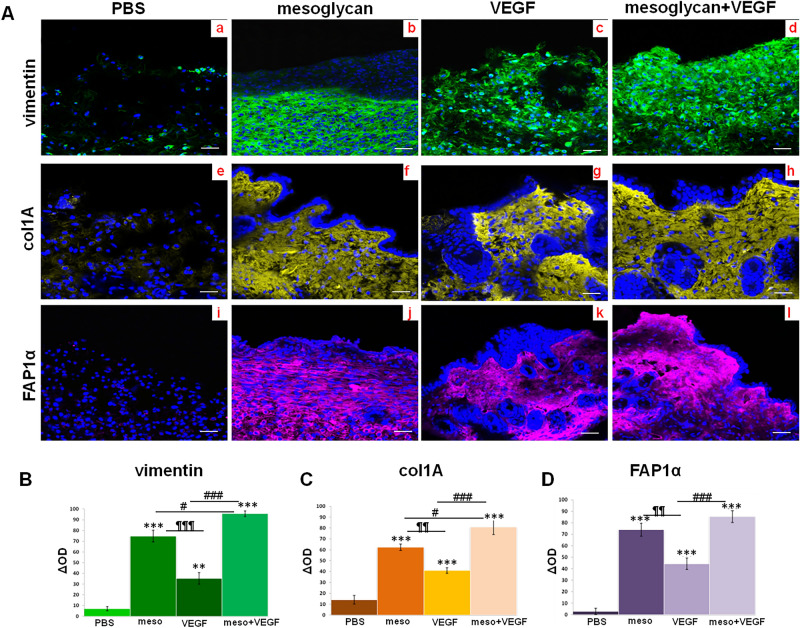
Figure 4.
(A) Immunofluorescence analysis of mice sections vimentin (panels a–d); col1A (panels e–h); FAP1α (panels i–I). Densitometry analysis of fluorescence intensity of the same protein markers (B) for vimentin; (C) for col1A; (D) for FAP1α). The data represent a mean of n = 3 independent experiments ± SD based on one-way ANOVA and a two-tailed Student's t-test as appropriated, *p < 0.05, **p < 0.01, ***p < 0.001 versus untreated control; #p < 0.05, ##p < 0.01, ###p < 0.001 for combination versus mesoglycan or VEGF treated cells; ¶¶p < 0.01; ¶¶¶p < 0.001 for VEGF treatment versus mesoglycan one.

