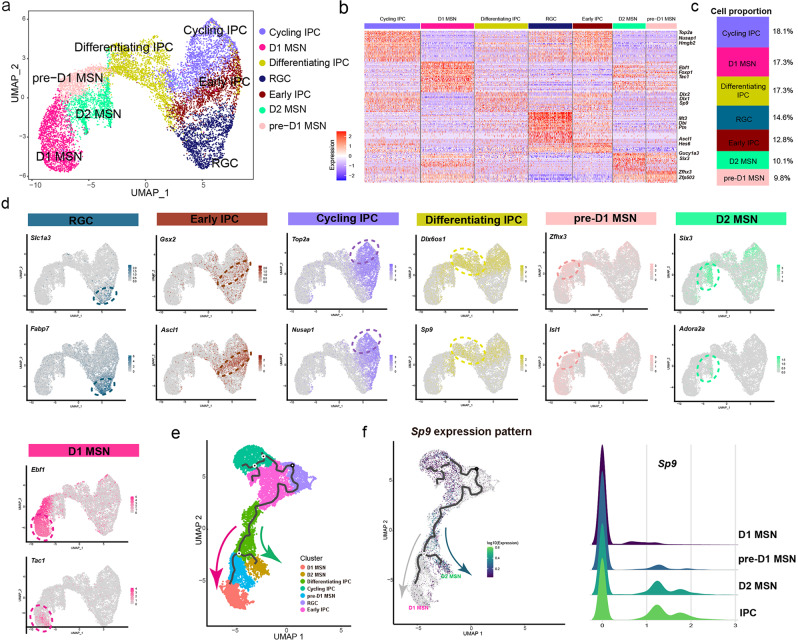
Fig. 2. Identification of the developmental hierarchy of LGE cells.
a The UMAP plot of LGE cells. b The heatmap of the LGE cells ordered by the UMAP showed in a. Each column represents expression in one cell, and each row represents expression of one gene. c The proportions of distinct clusters among total LGE cells. d UMAP plots of the expression levels of selected marker genes in the seven subpopulations. e Monocle3 revealed predicted lineage trajectories from RGC in the LGE; each point represents a cell and is colored on the basis of cluster identity. f Sp9 expression pattern in the predicted lineage trajectories, and ridge plots shows Sp9 expression distribution in the MSN Progenitor, pre-D1 MSN, D1 MSN, and D2 MSN.

