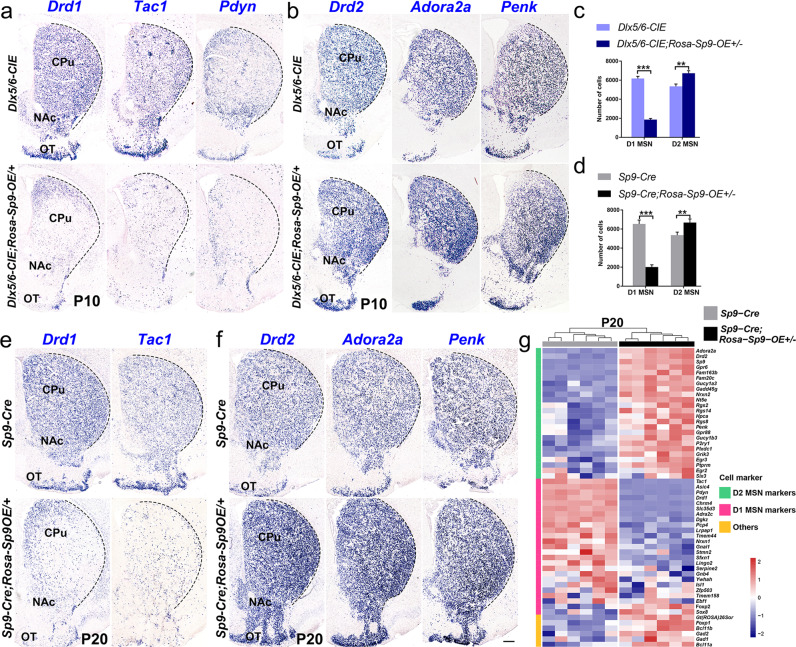
Fig. 7. Sp9 overexpression decreases the number of D1-MSNs and increases the number of D2-MSNs.
a–c In situ RNA hybridization of Drd1, Tac1, Pdyn, Drd2, Adora2a and Penk showing that the number of D1-MSNs was decreased by ~70% and that the number of D2-MSNs was increased by ~26% in the striatum of the Dlx5/6-CIE; Rosa-Sp9-OE/ + mice compared to control mice at P10 (Student’s t-test, **p < 0.01, ***p < 0.001, n = 3, mean ± SEM). d–f In situ RNA hybridization showing that the number of D1-MSNs was decreased by ~70% and that the number of D2-MSNs was increased by ~25% in the striatum of the Sp9-Cre; Rosa-Sp9-OE/ + mice compared with control mice at P20 (Student’s t-test, **p < 0.01, ***p < 0.001, n = 3, mean ± SEM). g The heatmap showing the expression level of MSN-enriched genes in the Sp9-Cre; Rosa-Sp9-OE/ + and Sp9-Cre striatum at P20 (obtained by bulk RNA sequencing). The expression of the D1-MSN markers was greatly downregulated, and the expression of the D2-MSN markers was significantly upregulated. Scale bar: 500 µm in f for a, b and e, f.

