© The Author(s) 2022
Open Access This article is licensed under a Creative Commons Attribution 4.0 International License, which permits use, sharing, adaptation, distribution and reproduction in any medium or format, as long as you give appropriate credit to the original author(s) and the source, provide a link to the Creative Commons licence, and indicate if changes were made. The images or other third party material in this article are included in the article's Creative Commons licence, unless indicated otherwise in a credit line to the material. If material is not included in the article's Creative Commons licence and your intended use is not permitted by statutory regulation or exceeds the permitted use, you will need to obtain permission directly from the copyright holder. To view a copy of this licence, visit http://creativecommons.org/licenses/by/4.0/.
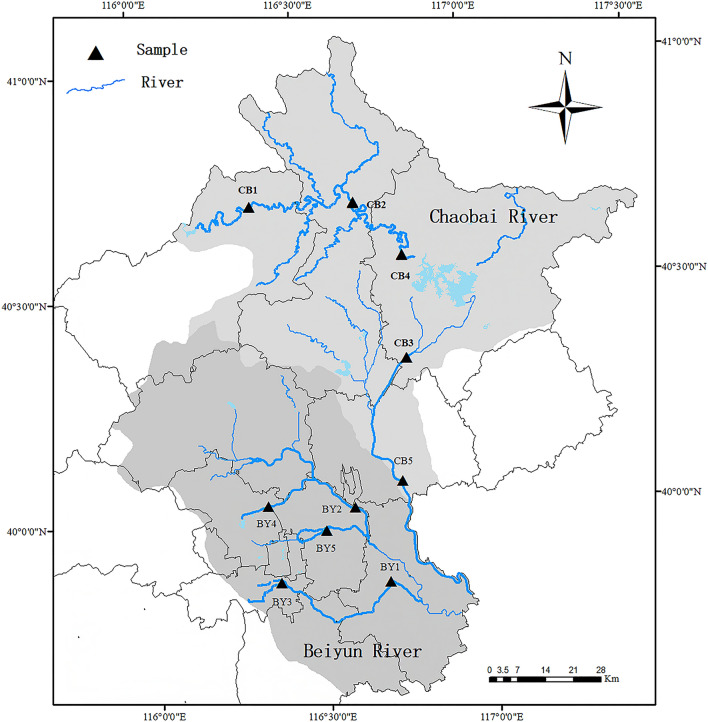
 light grey) and Beiyun River (
 dark grey), with a total of 10 points. At each sampling point (▲), 3 L of water was used for eDNA while ground cages were used to capture fish. This map was created using Arcgis version 10.6 (https://desktop.arcgis.com/) based on the Resource and Environment Science and Data Center (https://www.resdc.cn/Default.aspx), edited by Mei Shen].
