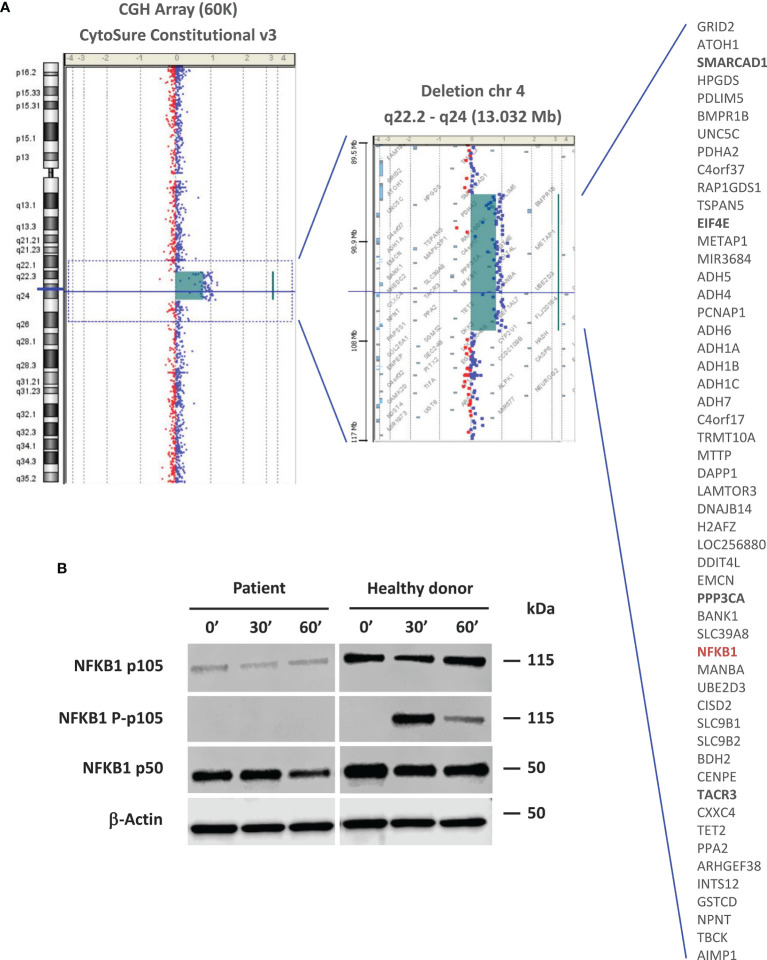
Figure 2.
Molecular and functional studies. (A) Array CGH-based identification of the 13-Mb deletion in the 4q22.2-q24 chromosomal region. Patient DNA was labeled with cyanine 3 (Cy3, red dots) and control DNA with cyanine 5 (Cy5, blue dots). The image is reported as the ratio of Cy5 and Cy3 fluorescence intensity. The list of genes encompassed by this deletion is shown. Genes that are likely related to the patient’s non-immune clinical phenotype are in bold. The NFKB1 gene is highlighted in red. (B) NF-kB pathway evaluation by western blot. NFKB1 p105/p50 expression and activation were evaluated in PBMC-derived protein extracts from the patient and a healthy donor. For a better comparison between the healthy donor and patient, we quantified the p105 and p50 bands using the ImageJ software. The quantification reflects the relative amounts as a ratio of each protein band relative to the lane’s loading control (β-actin): p105 patient (0’: 0.24, 30’: 0.20, 60’: 0.22); p105 healthy donor (0’: 0.79, 30’: 0.76, 60’: 1.10). p50 patient (0’: 1.07, 30’: 1.12, 60’: 0.74); p50 healthy donor (0’: 1.39, 30’: 1.27, 60’: 1.41).

