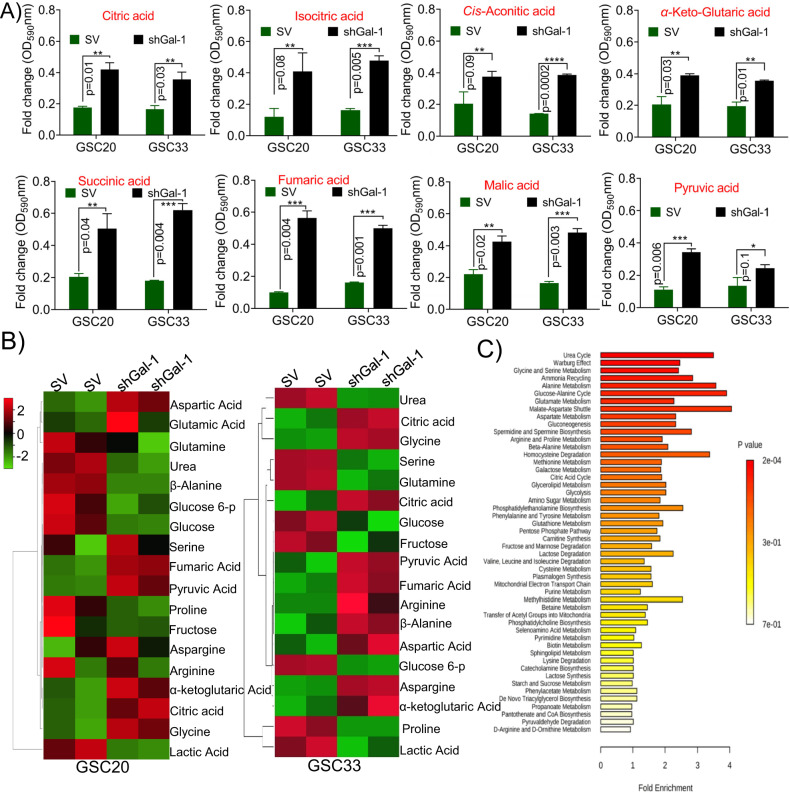
Fig. 3. Metabolite analysis upon Gal-1 manipulation in GSC.
A Biolog’s MitoPlates S1 (14105, Biolog) study was performed as per the manufacturer’s instruction. The data obtained from SV and shGal-1 treatment from both GSC20 and GSC33 were presented as a bar graph. B Evaluation of the metabolic profile in GSC20 and GSC33 using GC/MS analysis. The fold changes of different endogenous metabolites in SV and shGal-1 in GSC20 and GSC33 cells were plotted in a heatmap. C KEGG pathway fold enrichment analysis of all different endogenous metabolites.

