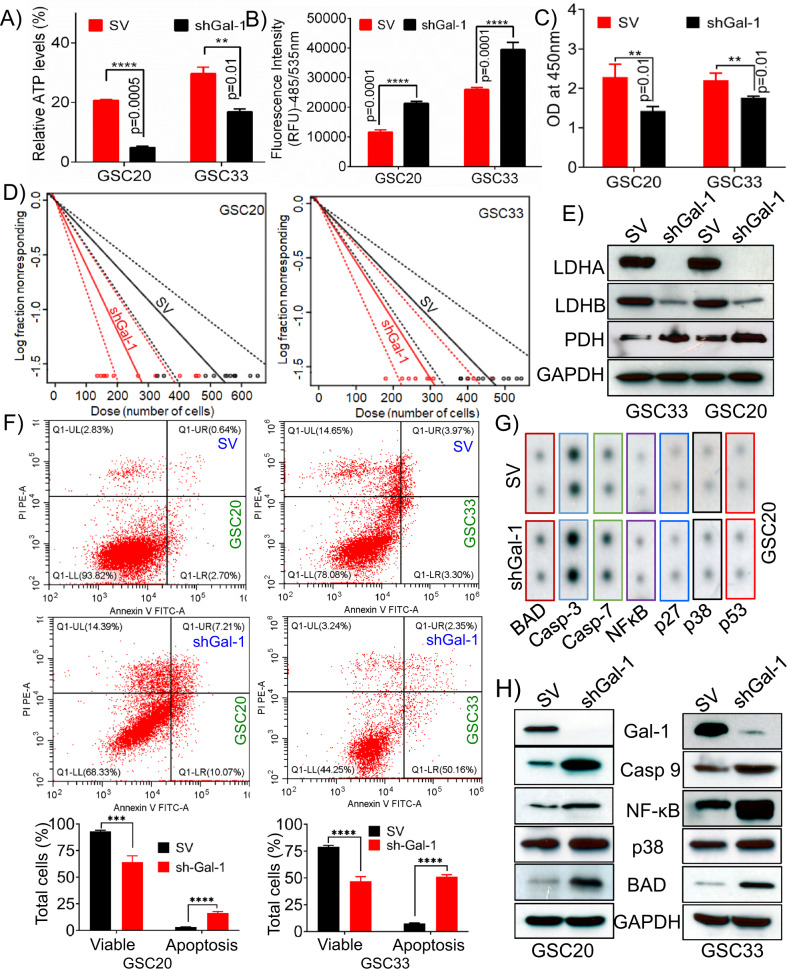
Fig. 4. Silencing Gal-1 reverses the Warburg effect and induces apoptosis.
A Cellular ATP in SV and shGal-1 stable cells in GSC20 and GSC33 cell lines. B DCFDA staining was used to determine ROS levels in SV and shGal-1 treatments in both GSC20 and GSC33. C BrdU assay to verify the cell viability in both SV and shGal-1 cells. D Limiting dilution assays to study the GSC proliferation in SV and shGal-1-treated GSC20 and GSC33 cells. Each result is representative of three independent experiments. E Immunoblot analysis of different glycolytic enzymes in SV and shGal-1-stable cells of GSC33 and GSC20. F GSC20 and GSC33 were analyzed for Annexin V/APC and PI-induced apoptosis following manipulation of shGal-1. Dot plots (Red dots) and bar graphs represent the percentage of healthy, necrotic, early apoptotic, and late apoptotic cells in GSC20 and GSC33 cells. These data were compared with those in the control group. G Human apoptosis signaling pathway array (Ray Biotech AAH-APOSIG), to verify the induction of apoptosis in the shGal-1-stable cells when compared to the SV in GSC20. H Immunoblot analysis of various apoptosis markers in shGal-1-stable cells.

