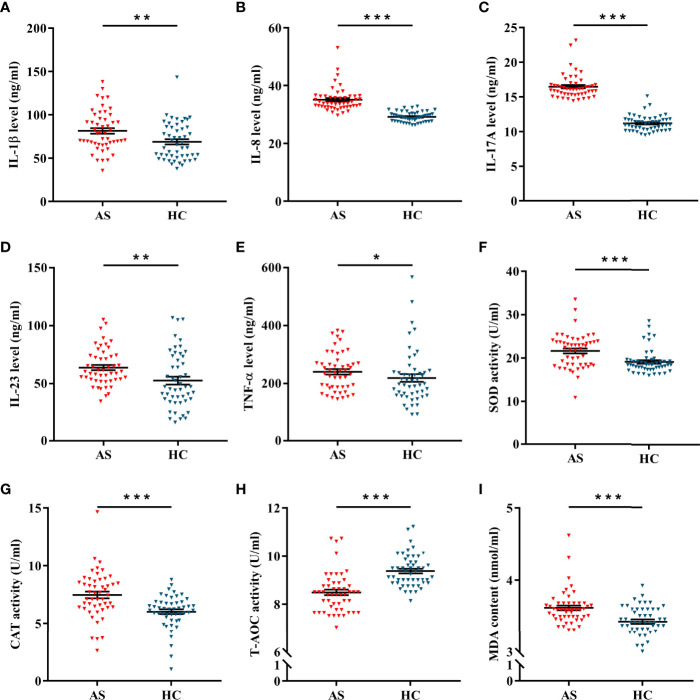
Figure 2.
The levels of inflammation and oxidative stress in AS and HC. (A–F) The expression of IL-1β (A), IL-8 (B), IL-17A (C), IL-23 (D) and TNF-α (E) between AS (n = 50) and HC (n = 50). (F–H) The activities of SOD (F), CAT (G), and T-AOC (H) between AS and HC. (I) The content of MDA between AS and HC. All data were expressed as mean ± SEM. The differences between AS and HC were analyzed using Mann-Whitney U test. * P < 0.05, ** P < 0.01, *** P < 0.001. AS, ankylosing spondylitis; HC, healthy control.

