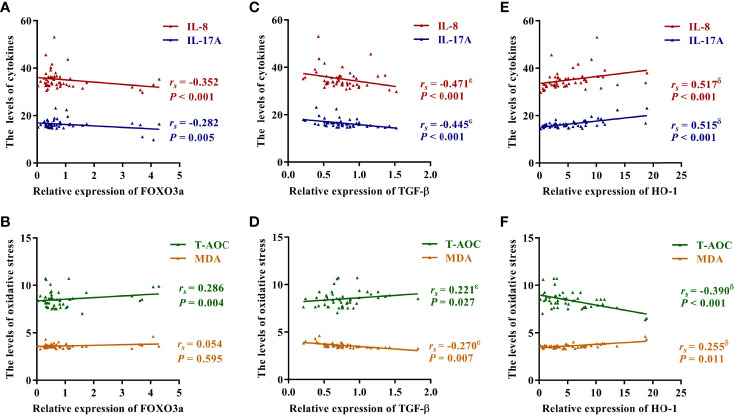
Figure 3.
Correlation between FOXO3a, TGF-β, HO-1 and inflammation and oxidative stress. (A) Correlation between FOXO3a and IL-8 and IL-17A. (B) Correlation between FOXO3a and T-AOC and MDA. (C) Correlation between TGF-β and IL-8 and IL-17A. (D) Correlation between TGF-β and T-AOC and MDA. (E) Correlation between HO-1 and IL-8 and IL-17A. (F) Correlation between HO-1 and T-AOC and MDA. The correlation was analyzed using spearman rank correlation and partial correlation. rs , Spearman’s rank correlation coefficient; ϵ, the correlation was still significant in partial correlation analysis which controlling for HO-1; δ, the correlation was still significant in partial correlation analysis which controlling for TGF-β.

