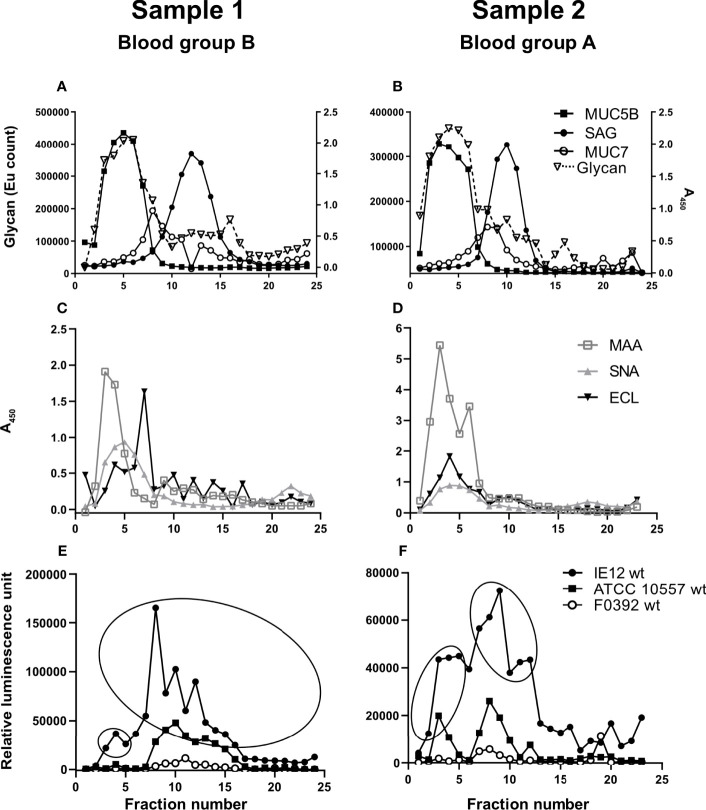
Figure 1.
Soluble salivary mucins and their binding to lectins and S. oralis. Fractions from CsCl density gradient centrifugation of the soluble saliva fractions were collected from the bottom of the tube (i.e. the low fraction numbers have the highest density), diluted 1:100 and analyzed for: (A, B) glycan content, MUC5B, MUC7 and SAG. (C, D) Fractions were probed with the lectins SNA-I for α2,6-linked sialic acid, MAA for α2,3-linked sialic acid and ECL for Galβ1-related oligosaccharides. To visualize the MAA and ECL signals in the graphs, the signals were multiplied by 10. Please note that a stronger signal with one lectin than another does not imply that there is more of a certain structure and refer to the mass spectrometry results for comparison of the abundance between the glycans. (E, F) Fractions were assessed for S. oralis IE12 WT, ATCC 10557 WT and F0392 WT binding. For further analysis, fractions were pooled to obtain one MUC5B rich and one MUC7/SAG rich sample for each gradient in accordance with the ellipses.

