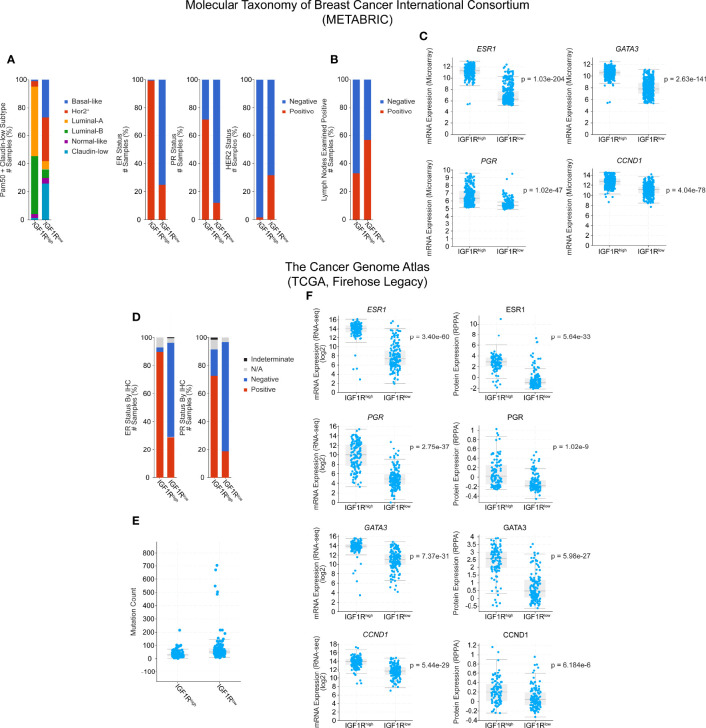
Figure 1.
Clinical characteristic and gene expression analysis of IGF1Rhigh and IGF1Rlow human breast tumors from the Molecular Taxonomy of Breast Cancer International Consortium (METABRIC) and The Cancer Genome Atlas (TCGA) databases. Cohorts were generated by classifying patients by either high (z-score > 1, METABRIC n = 300, TCGA n = 128) or low (z-score < -1, METABRIC n = 415, TCGA n = 153) expression of IGF1R, while average patients (-1 < z-score < 1) were excluded. (A) PAM50 classification of patient tumors and hormone receptor expression status. (B) Lymph node positivity. (C) Gene expression microarray data for ESR1, PGR, GATA3, and CCND1. (D) Hormone receptor status in the TCGA cohorts. (E) Mutation count. (F) Gene (left) and protein (right) expression data for ESR1, PGR, GATA3, and CCND1. Statistical analyses were generated by cBioPortal and are student t-tests, where significance was defined as p < 0.05. N/A, Not Available.

