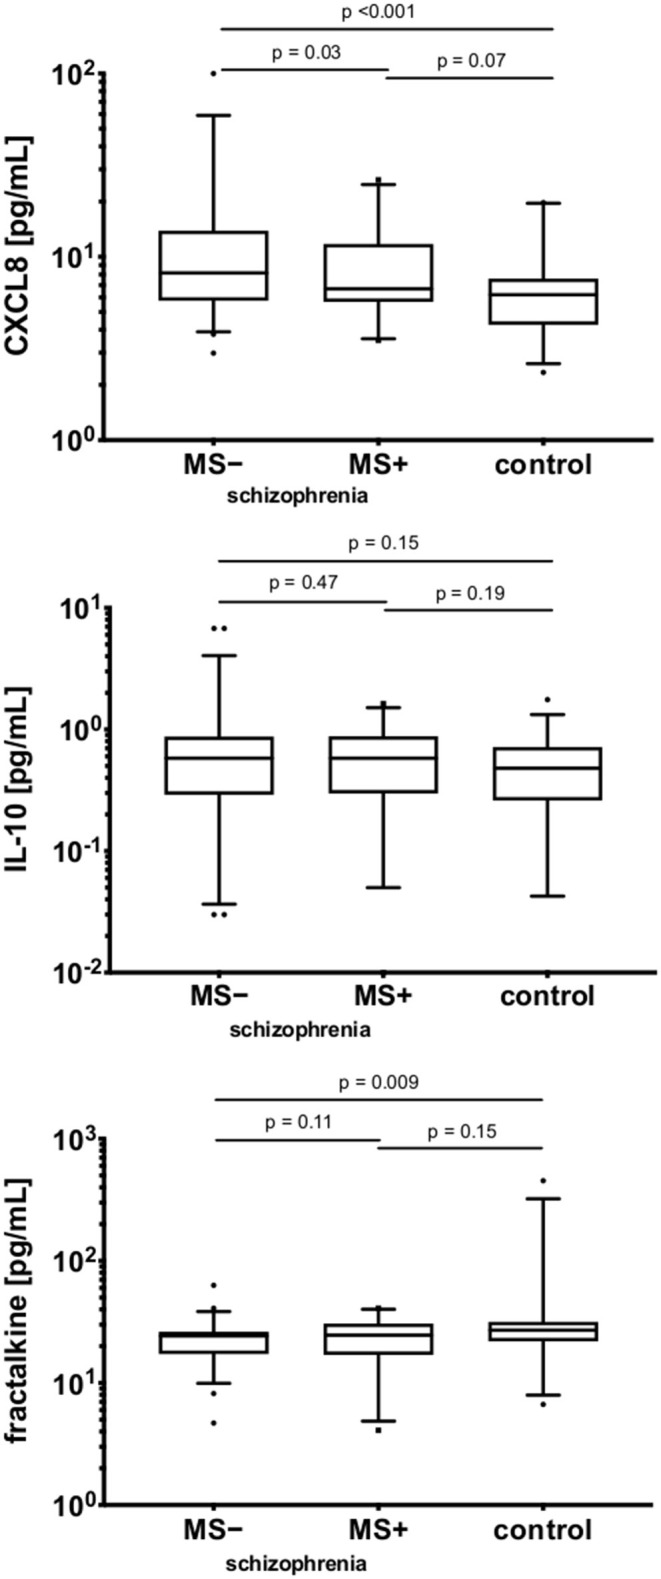
Figure 3.

The comparison of serum CXCL8, IL-10, and fractalkine in the schizophrenia and control groups.MS −, patients on mood-stabilizers; MS +, patients without stabilizers. Y axes are log10 scaled. The boxes extend from 25 to 75th percentiles, the lines in the middle of the boxes represent medians. The whiskers extend from 10 to 90th percentiles.
