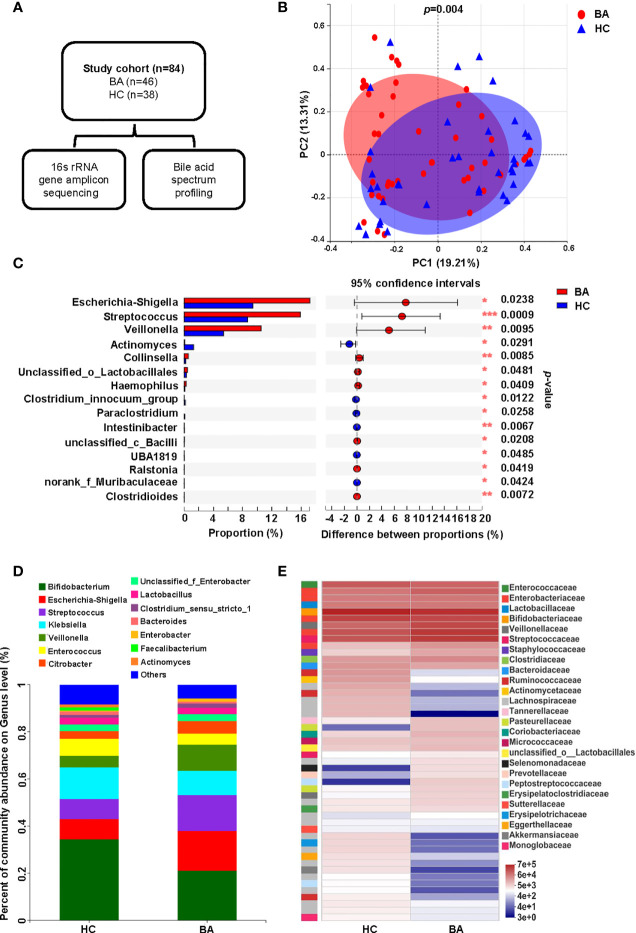
Figure 1.
Fecal microbiome variations and composition in BA and HC groups. (A) Overview of the study design. (B) Beta diversity (principal coordinates analysis based on the Bray-Curtis distance of genus abundance) between the two groups. (C) Microbiota with significantly different abundances between the two groups at the genus level (*p < 0.05, **p < 0.01, and ***p < 0.001). (D) Bar diagram of the fecal microbial composition in the two groups. (E) Community heatmap presenting information on the genus-level composition and abundance of the community between the two groups, with color changes reflecting the similarities and differences in community composition. BA, biliary atresia; HC, health control; PCoA, principal coordinated analysis.

