Figure 5.
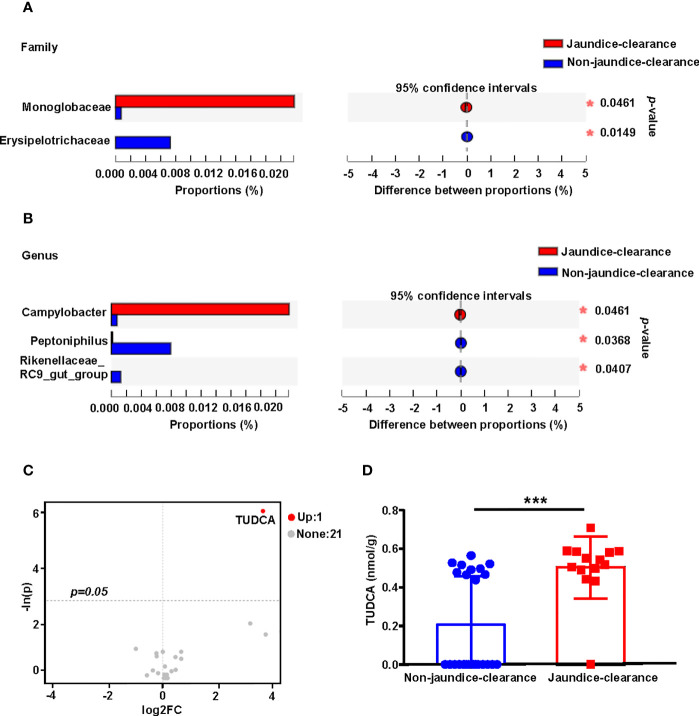
Fecal microbiota distribution and bile acid profile for patients with jaundice clearance at 6 months after Kasai surgery. Microbiota with significantly different abundances at the family (A) and genus (B) levels between jaundice-clearance and non-jaundice-clearance groups. (C) The volcano plot shows the differential metabolites screened based on a unidimensional statistical analysis. The thresholds in the plot were set as follows: p < 0.05 and between-group variation multiplier, absolute value of FC ≥ 0. (D) Box diagram of different levels of TUDCA between jaundice-clearance and non-jaundice-clearance groups. *p < 0.05, ***p < 0.001. FC, Fold Change; TUDCA, tauroursodeoxycholic acid.

