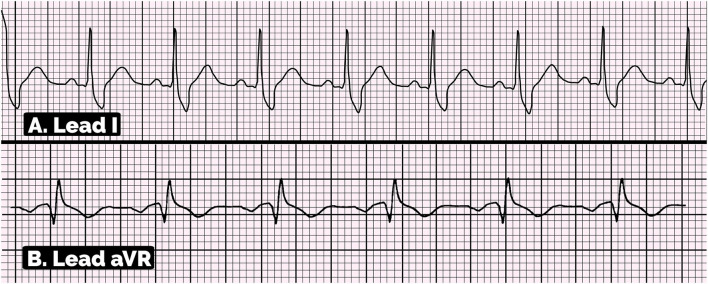
Figure 5.
Electrocardiographic pattern of positive aVR sign and large S wave in lead I. (A) This ECG showed S-wave amplitude ≥0.1 mV and duration >40 ms in lead I, suggesting the large S wave in lead I. (B) This ECG showed the positive aVR sign with the amplitude of R wave in aVR lead is ≥0.3 mV and R/q ratio is ≥0.7.

