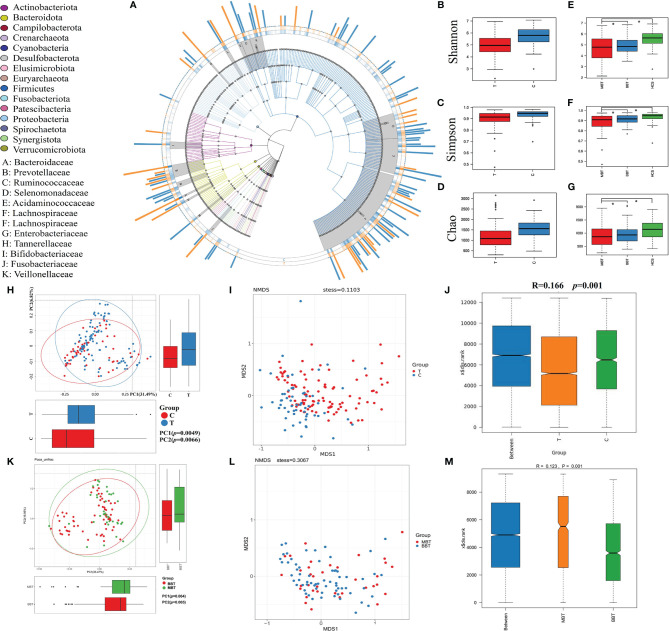
Figure 1.
The general distribution and microbial diversity in the gut microbiota of all participants. Distribution and species tree of the intestinal bacterial community (A). The differences in alpha diversity were estimated by the Shannon, Simpson, and Chao1 indices. Shannon indices between the two groups (brain tumor group and healthy group, B) and three groups (benign brain tumor group, malignant brain tumor group and healthy group, E). The Simpson indices of the two groups (C) and three groups (F). The Chao1 indices of the two groups (D) and three groups (G). The variation in these data could be analyzed by unpaired t tests or Wilcoxon rank-sum tests. The asterisk suggests p <0.05. Principal coordinate analysis (PCoA) based on the unweighted UniFrac distances and nonmetric multidimensional scaling of bacterial beta diversity between the brain tumor group and the healthy group (H, I) and between the MBT group and BBT group (K, L). Each point represents a sample. Analysis of similarities (ANOSIM) between the brain tumor group and the healthy group (J) and between the MBT group and the BBT group (M). We defined p=0 when p<0.000001.

