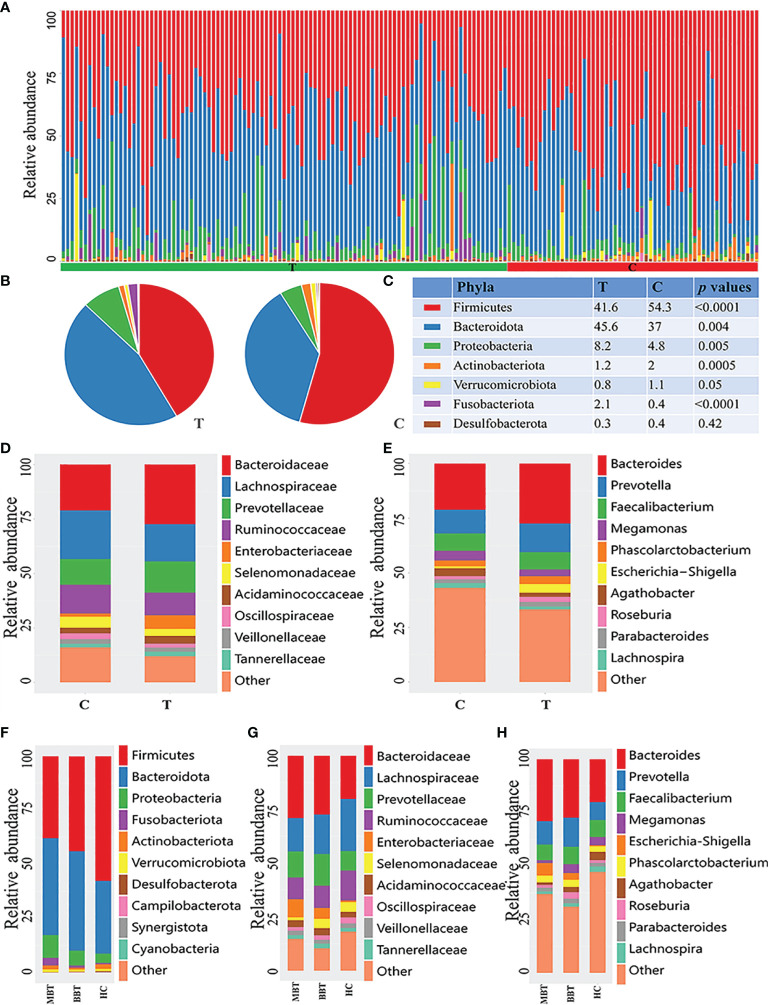
Figure 2.
Composition of microbial community at different levels of different groups. The phylum-level distribution of all samples (A), brain tumor group and healthy group (B). The proportion and comparation of the top seven bacteria at phylum level of T and C groups (C). Each color represents a kind of bacteria. The microbial family (D) and genera (E) between T and C groups. And the analysis of subgroups at the level of phylum (F), family (G) and genus (H) in malignant brain tumours (MBT), benign brain tumours (BBT) and healthy group (HC).

