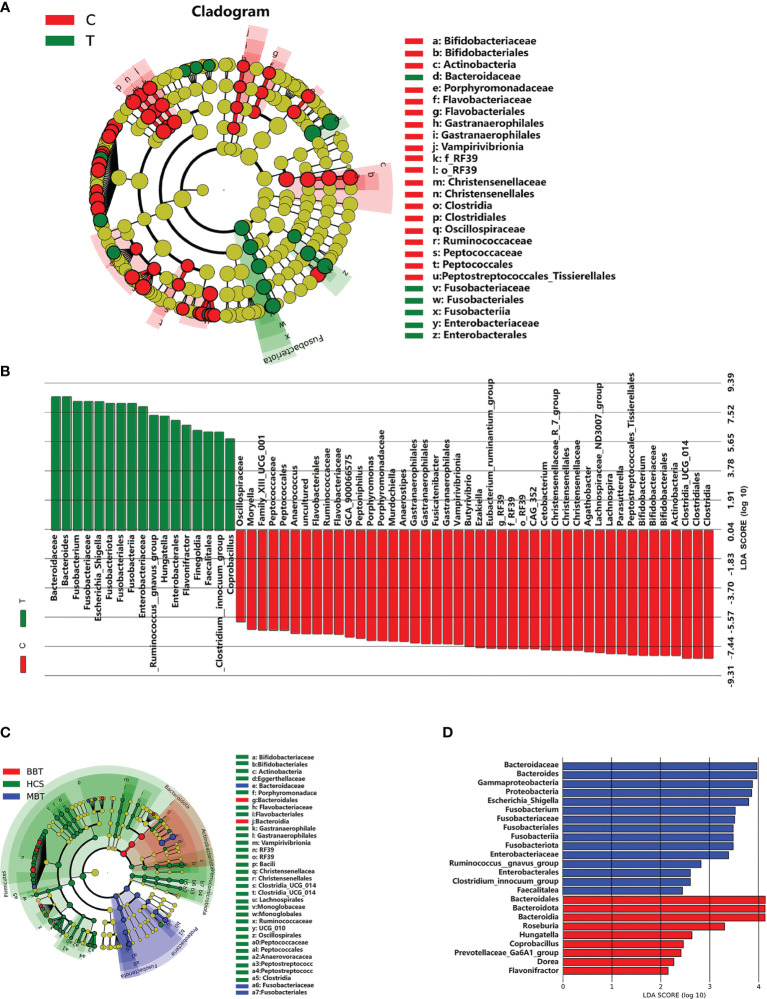
Figure 3.
Differential enriched bacterial taxa between different groups. Linear discriminant analysis (LDA) integrated with effect size (LEfSe) was used to identify the taxa with the greatest differences in abundance between different groups. Cladogram indicating the phylogenetic distribution of microbiota correlated with the T or C groups (A). Histogram of the LDA scores computed for differentially abundant taxa between T and C groups (B). Meanwhile, the enriched taxa in the malignant brain tumours, benign brain tumours and the healthy were also displayed in the cladogram (C), and the differences in abundance between the malignant and benign brain tumours (D). The central point represents the root of the tree (microorganism), and each ring represents the next lower taxonomic level. The diameter of each circle represents the relative abundance of the taxon, only the taxa satisfied an obvious LDA threshold value of >2 are presented.

