Figure 4.
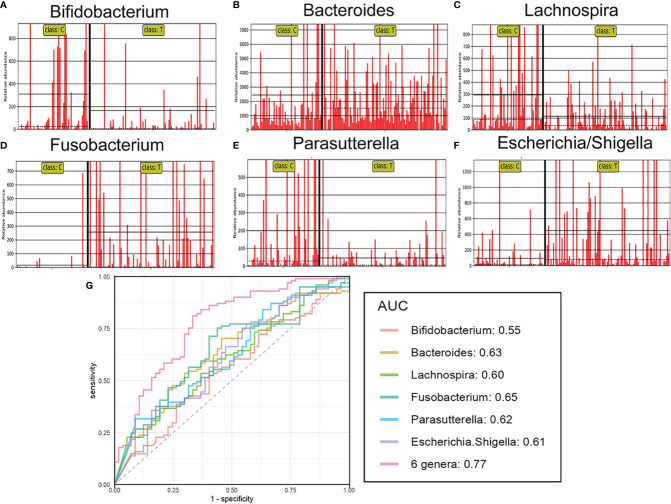
The relative abundance and predictive ability for brain tumours of differential genera. The relative abundance of the differential genera such as Bifidobacterium (A), Bacteroides (B), Lachnospira (C), Fusobacterium (D), Parasutterella (E), Escherichia/Shigella (F) in each sample. Receiver operating characteristic (ROC) curves for the differential genera alone or in combination (G), which was calculated to discriminate brain tumor patients from healthy controls. AUC: the area under the receiver operating characteristic curve.

